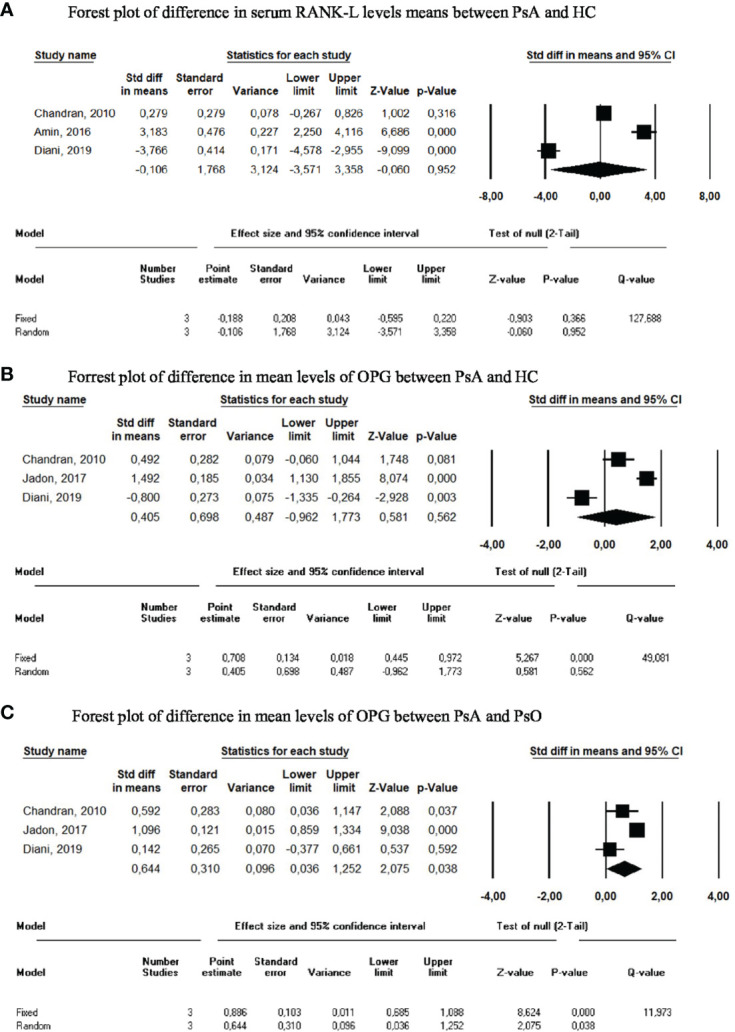
Figure 4.

Meta-analysis of circulating biomarkers. (A) Forest plot of difference in serum RANK-L levels means between PsA and HC. (B) Forrest plot of difference in mean levels of OPG between PsA and HC. (C) Forrest plot of difference in mean levels of OPG between PsA and PsO.
