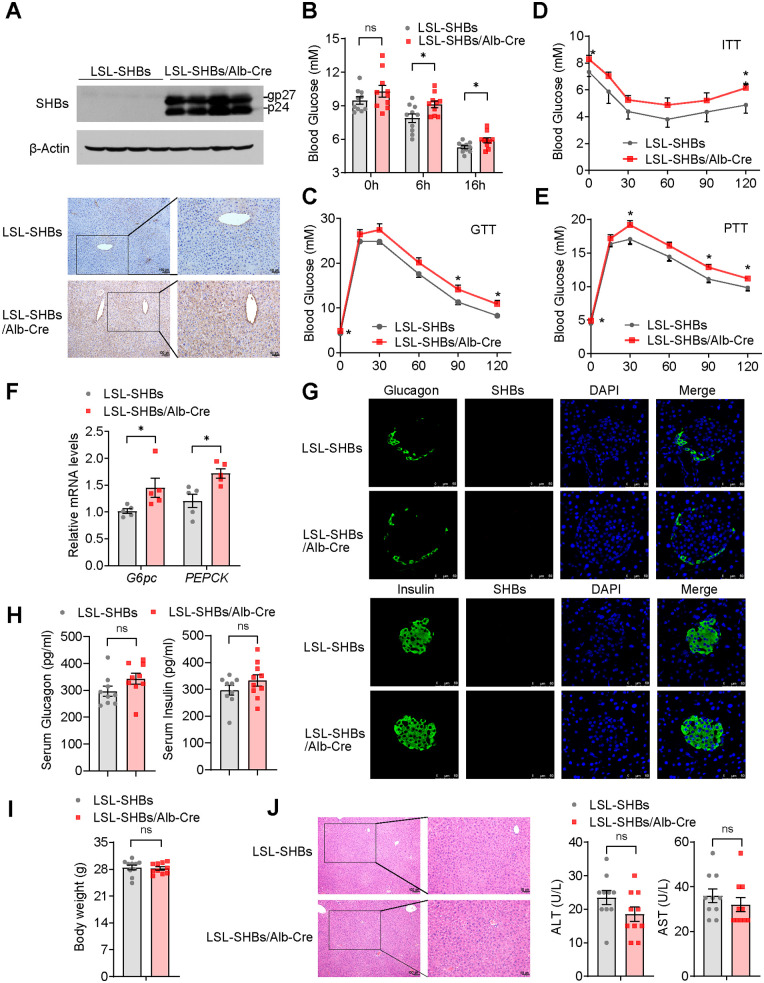
FIG 3.
SHBs transgenic mice exhibited a higher gluconeogenesis than control mice. (A) Western blot analysis (top) and immunohistochemical analysis (bottom) of SHBs expression in the liver of LSL-SHBs/Alb-Cre mice. The glycosylated (gp) and nonglycosylated (p) forms of SHBs were indicated. (B) Blood glucose levels of LSL-SHBs and LSL-SHBs/Alb-Cre mice in the fed group and at 6 h and 16 h fasted state (n = 10 mice/group). (C to E) Blood glucose levels were measured in LSL-SHBs and LSL-SHBs/Alb-Cre mice at 0, 15, 30, 60, 90, and 120 min after 16 h of fasting and intraperitoneal injection of 2 g/kg glucose (GTT) or pyruvate (PTT) or after 5 h of fasting and intraperitoneal injection of 0.5 U/kg insulin (ITT) (n = 6 to 10 mice/group). (F) Relative mRNA expression levels of hepatic gluconeogenic genes in LSL-SHBs and LSL-SHBs/Alb-Cre mice (n = 5 mice/group). (G) Expression of SHBs in pancreatic islets of LSL-SHBs and LSL-SHBs/Alb-Cre mice detected by immunofluorescence assay. The sections were immunostained for SHBs (red) and glucagon or insulin (green) as indicated. (H, I) The serum glucagon and insulin levels (H) and body weight (I) of LSL-SHBs and LSL-SHBs/Alb-Cre mice after 16 h fasting (n = 9 to 10 mice/group). (J) Hematoxylin-eosin staining on serial sections of livers (left) and the levels of serum ALT and AST (right, n = 10 mice/group) in LSL-SHBs and LSL-SHBs/Alb-Cre mice. Data are presented as means ± SEM. *, P < 0.05; ns, no significant difference.

