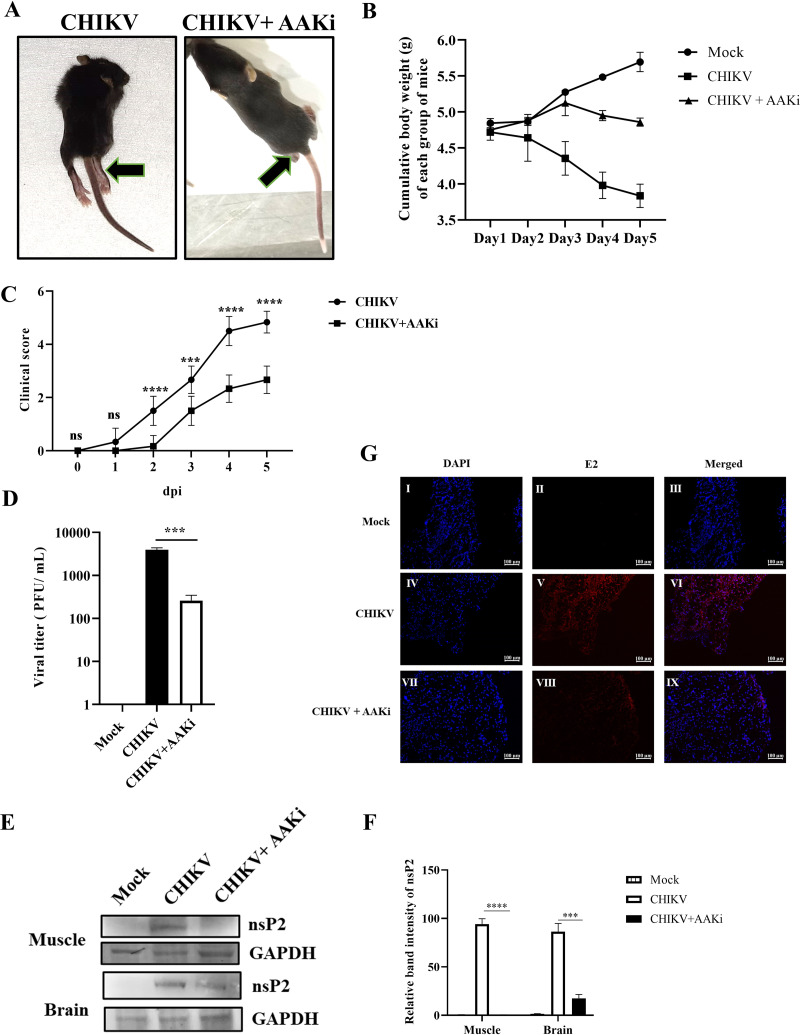
FIG 4.
Efficient inhibition of CHIKV infection by AAKi in mice. C57BL/6 mice were infected subcutaneously with 107 PFU of CHIKV and treated with 2 mg/kg of AAKi at 24-h intervals up to 4 dpi. Mice were sacrificed at 5 dpi, and sera and different tissues were collected for further experiments. An equal volume of sera was taken to estimate viral titer by plaque assay. (A) Images of CHIKV-infected and drug-treated mice at 4 dpi, and the arrows show the development of hind limb paralysis in infected mice. (B) Graph exhibiting the cumulative body weight of each group of mice throughout the study. (C) Graph representing the clinical scores of the disease symptoms of mice during CHIKV infection which were monitored from 1 dpi to 5 dpi (n = 6). The data are represented as mean ± SD. The 2-way ANOVA with Sidak’s posttest was used. ***, P ≤ 0.001; and ****, P ≤ 0.0001 were considered statistically significant. (D) Bar diagram showing the viral titers of virus-infected and drug-treated mice sera, obtained through the GraphPad Prism software (n = 3) where the one-way ANOVA with Dunnett’s posttest was used. ***, P ≤ 0.001 was considered statistically significant. (E) Western blot showing the viral nsP2 protein in muscle and brain tissue samples. GAPDH was used as a loading control. (F) Bar diagram exhibiting the relative band intensities of nsP2 in muscle and brain tissue samples from infected or drug-treated mice, and it was obtained through the GraphPad Prism software (n = 3) where the 2-way ANOVA with Sidak’s posttest was used. ***, P ≤ 0.001 and ****, P ≤ 0.0001 were considered statistically significant. (G) Confocal microscopic images showing the CHIKV-E2-stained muscles from infected or drug-treated mice. Scale bar = 100 μM. Data of three independent experiments are shown as mean ± SD.

