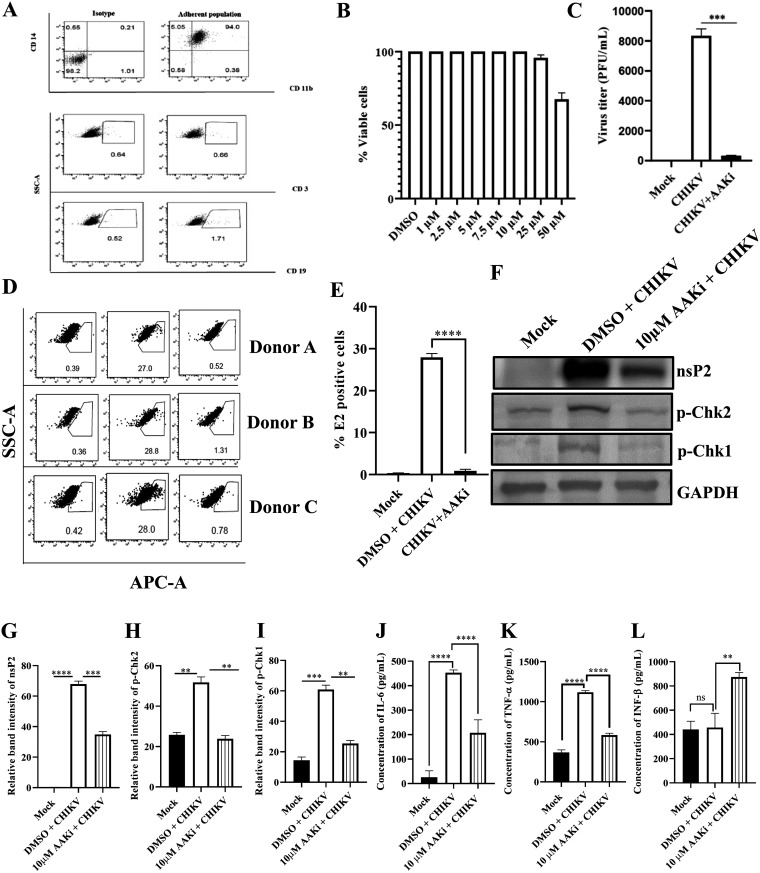
FIG 9.
AAKi reduces CHIKV infection in the hPBMC-derived monocyte-macrophage populations ex vivo and RAW264.7 cells. The human PBMCs were isolated from blood samples of three healthy donors and infected with CHIKV. (A) Dot plot showing the percentages of B cells (CD19), T cells (CD3), and CD14+CD11b+ monocyte-macrophage cells from adherent hPBMCs by flow cytometry. (B) Bar diagram representing the cytotoxicity of AAKi in the hPBMC-derived adherent cell populations by the MTT assay. (C) Bar diagram depicting the percentage of the viral particle formation obtained by plaque assay. (D) Dot plot showing the percentage of the viral E2-positive hPBMC-derived monocyte-macrophage population in mock, CHIKV-infected, and AAKi-treated CHIKV-infected samples using flow cytometry. (E) Bar diagram showing the percentage of positive cells for the CHIKV E2 protein, as derived by flow cytometry assay. The RAW264.7 cells were infected with CHIKV and treated with 10 μM AAKi. The cells and supernatants were harvested at 8 hpi for Western blot and sandwich ELISA, respectively. (F) Western blot image depicting the nsP2, p-Chk2, and p-Chk1 protein levels in mock, infected, and infected plus treated cells. GAPDH served as a loading control. (G, H, and I) Bar diagrams representing the relative band intensities of nsP2, p-Chk2, and p-Chk1. (J, K, and L) Bar diagrams showing the levels of secreted cytokines (IL-6, TNF-α, and IFN-β) in the cell culture supernatants. Data of three independent experiments are shown as mean ± SD. **, P ≤ 0.01; ***, P ≤ 0.001; and ****, P ≤ 0.0001 were considered statistically significant. ns, not significant.

