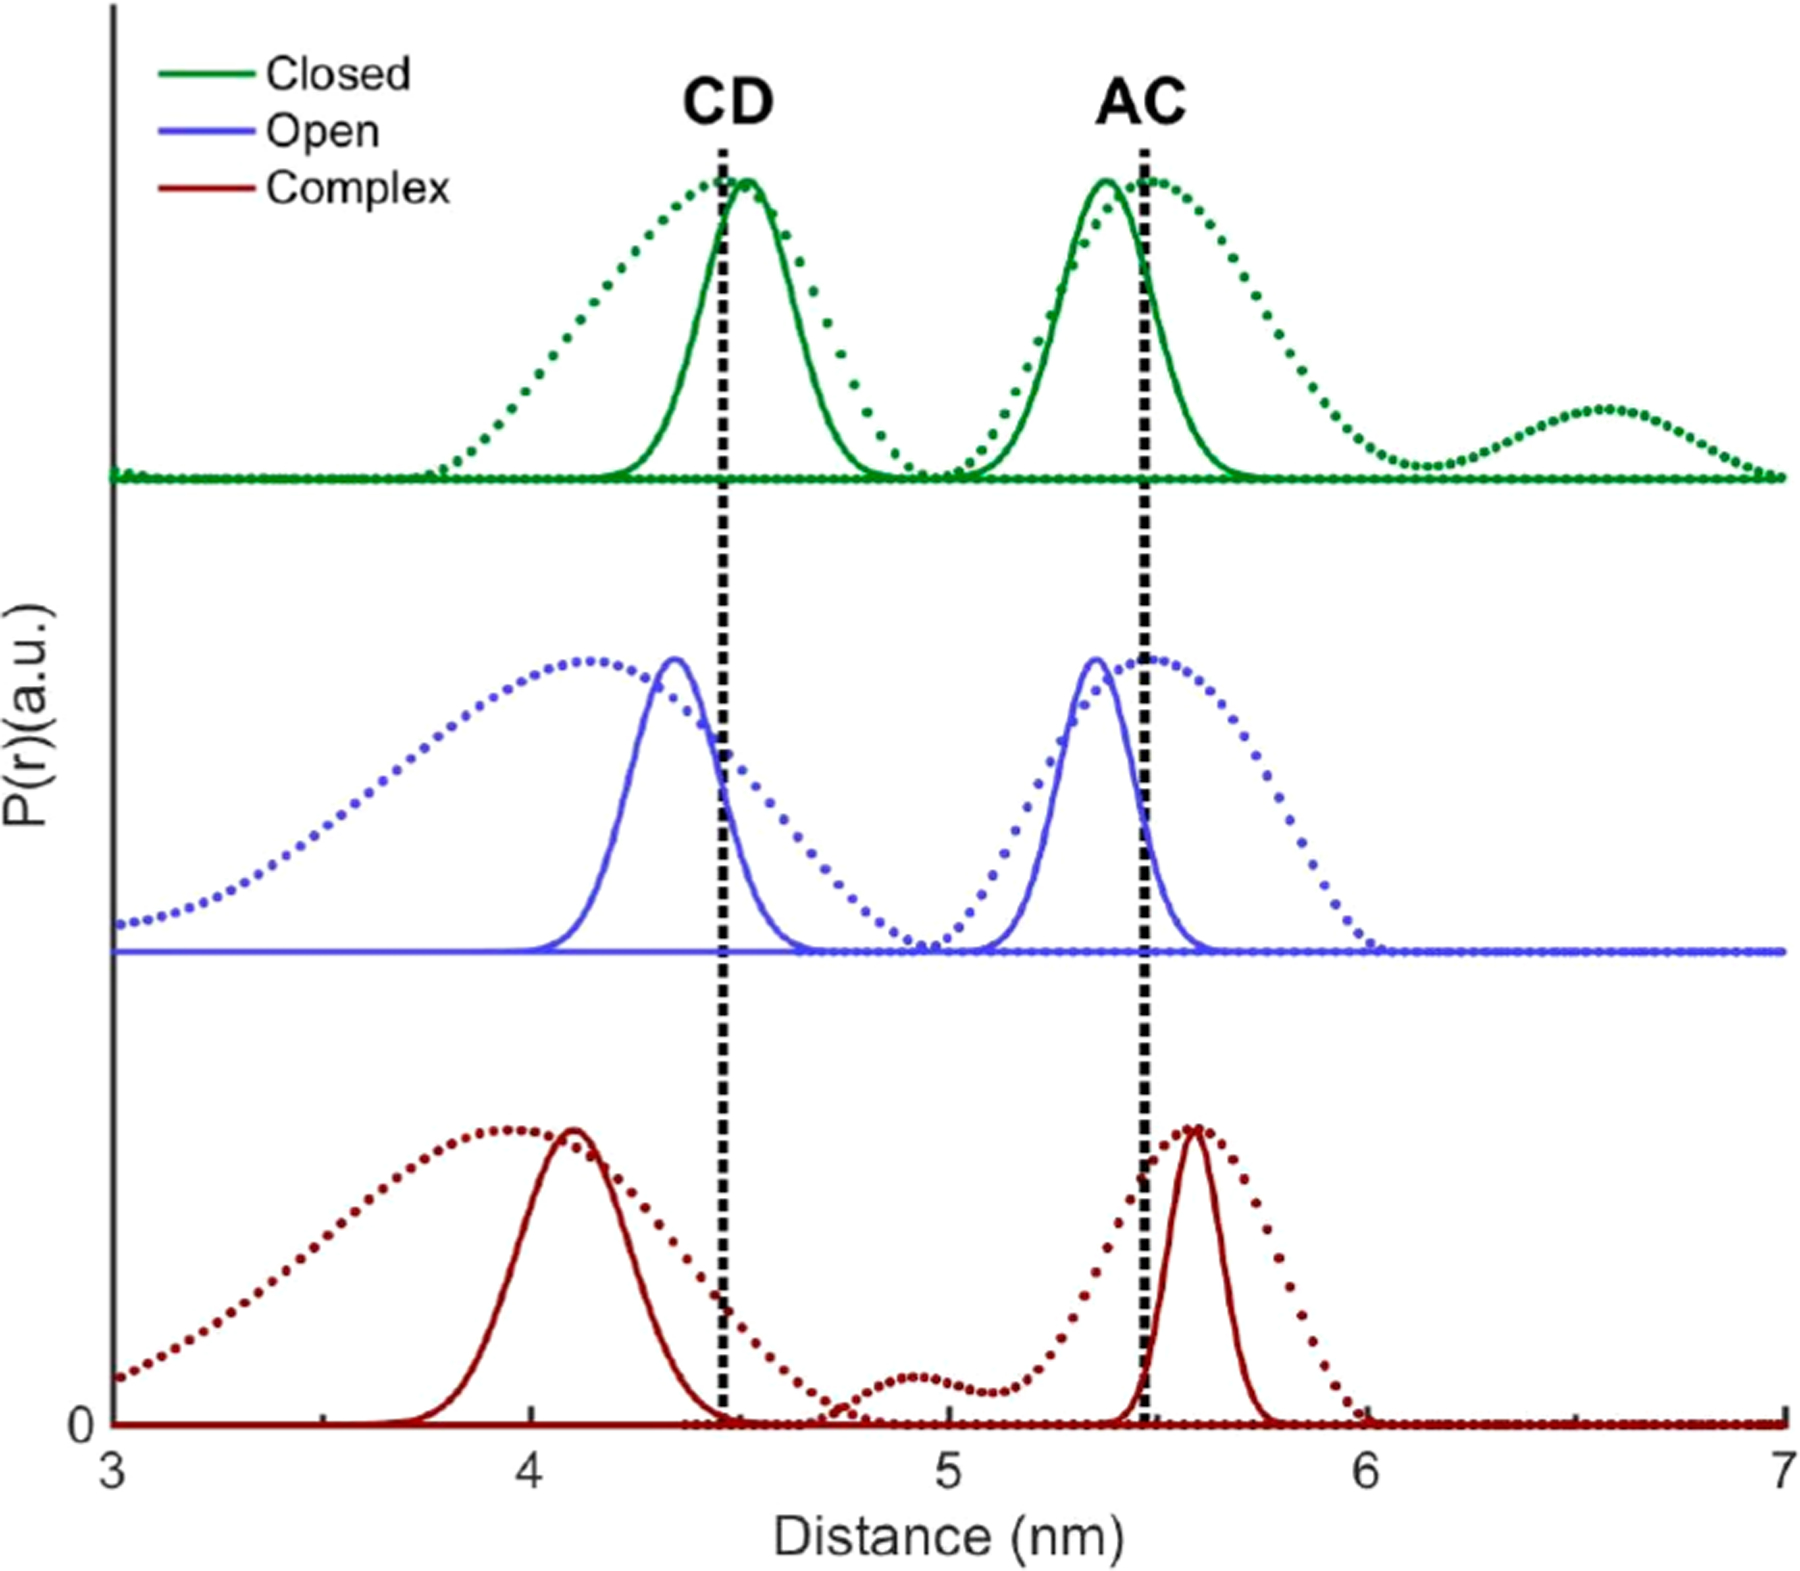
Figure 8.

Comparison of MD distance distributions (solid curves) of P450cam BSL-CD and BSL-AC with their corresponding main DEER peaks (dotted curves) for different states, the camphor-bound (green), camphor-free (blue), and camphor- and Pdx-bound (red) states. The dashed lines indicate DEER distances at the distance distribution peaks for closed states of BSL-CD and BSL-AC.
