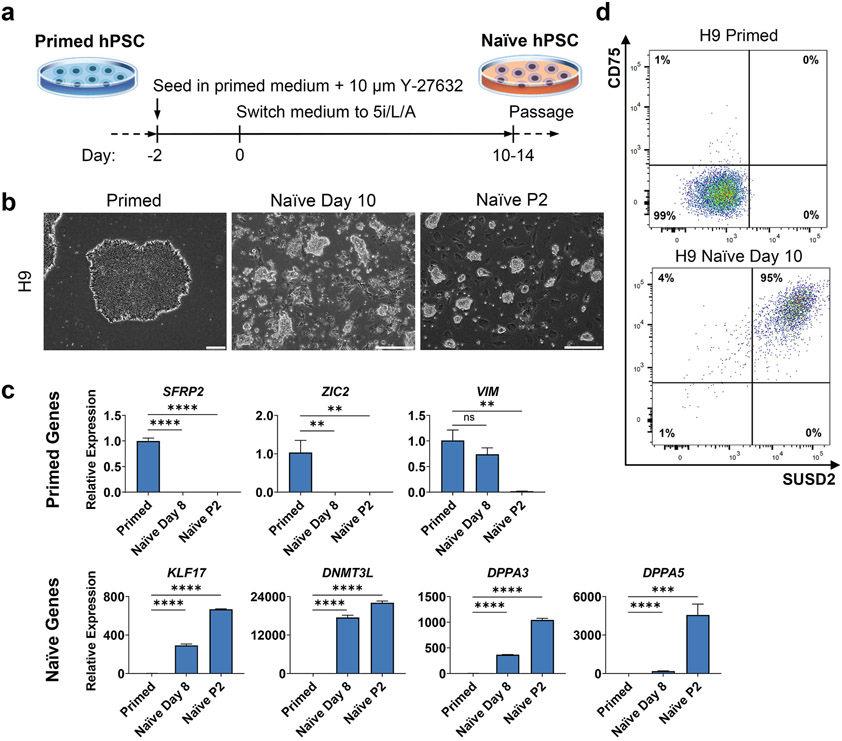
Figure 1. Induction of naïve pluripotency in genetically unmodified H9 primed hESCs using 5i/L/A.
A. Timeline of primed-to-naïve conversion using 5i/L/A.
B. Phase contrast images of primed and naïve H9 hESCs. Scale bars represent 250 μm.
C. Quantitative gene expression analysis of primed and naïve H9 hESCs for primed markers SFRP2, VIM, and ZIC2, and naïve markers KLF17, DNMT3L, DPPA3, and DPPA5. Error bars indicate ± 1 SD of technical replicates. “ns” indicates p-value of >0.05. “**” indicates p-value of <0.01. “***” indicates p-value of <0.001. “****” indicates p-value of <0.0001.
D. Flow cytometry analysis of primed and naïve H9 hESCs for naïve markers SUSD2 and CD75.

