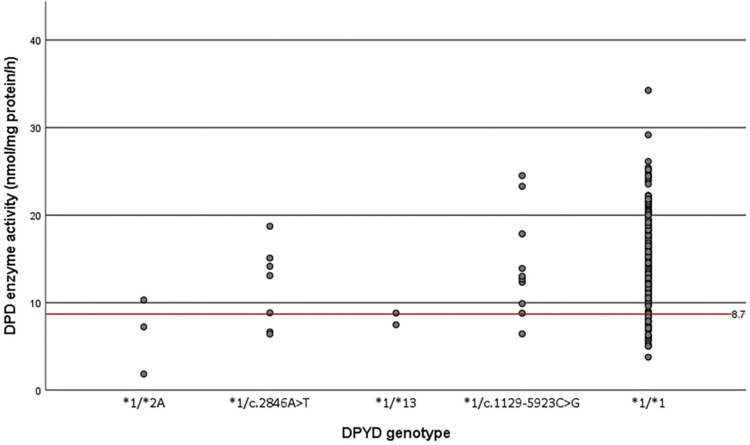
Figure 1.
Results of the DPD enzyme activity assay using ex vivo PBMCs are shown on the y-axis, the different DPYD genotypes that are known to influence DPD enzyme activity can be seen on the x-axis: DPYD*2A/*1 (c. 1905+1 G>A; rs3918290), c. 2846A>T/*1 p.(Asp949Val); rs67376798), DPYD*13/*1 (c. 1679T>G p.[Ile560Ser]; rs55886062), c.1129-5923C>G/*1 (rs75017182) and *1/*1. The dots represent patients who are all heterozygous carriers of one of the four variants. The red line represents the cut-off value for decreased DPD activity (<8.69 nmol/mg protein/h).
DPD: dihydropyrimidine dehydrogenase; PBMC: peripheral blood mononuclear cell.

