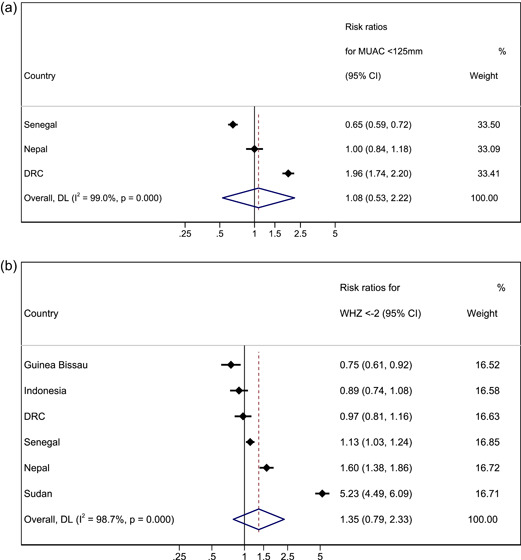
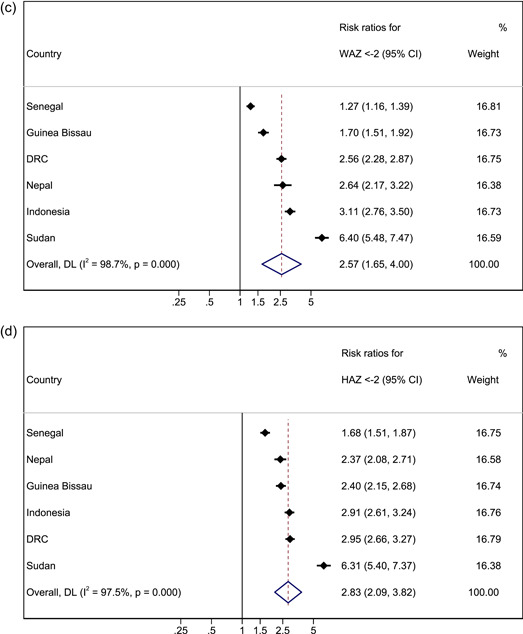
Figure 2.
Forest plots for pooled risk ratios of mortality in children 6–23 months versus 24–59 months for MUAC < 125 mm WHZ < −2, WAZ < −2 and HAZ < −2. (a) Mortality risk ratio between younger and older (reference group) age group for MUAC < 125 mm. (b) Mortality risk ratio between younger and older (reference group) age group for WHZ < −2. (c) Mortality risk ratio between younger and older (reference group) age group for WAZ < −2. (d) Mortality risk ratio between younger and older (reference group) age group for HAZ < −2. Estimates on the left part of the axis suggest a higher mortality in older children, and estimates on the right part of the axis suggest a higher mortality among younger children.


