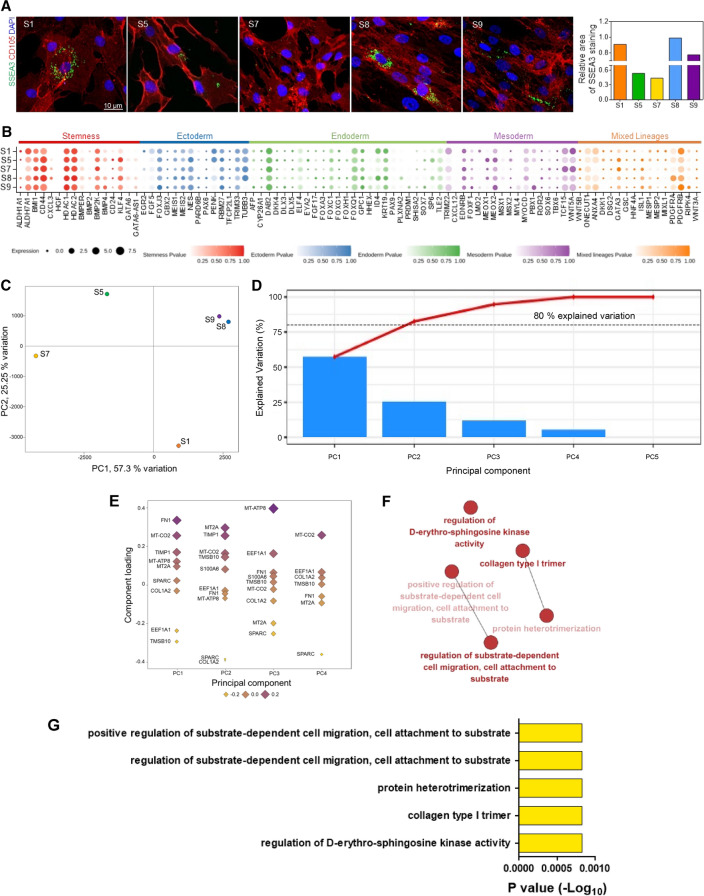
Figure 3.
(A) Immunofluorescence images presenting a difference in the multipotency of hNTSCs from different donors. (B) Dot plot presenting expression of stemness-related genes within five different cells: the frequency of cells within a cluster expressing the gene of interest (dot size) and the level of expression of the gene (the degree of color intensity) are visualized. (C) Principal component analysis (PCA) and (D) scree plots for PCA. (E) PCA loading plot presenting the transformation factors of PCA. (F) Functional enrichment analysis visualized by each gene ontology (GO) term in which each node is linked according to a kappa score of ≥ 0.4. FDR.adj.p-value (FDR adjusted p-value). (G) Statistical significance and number of each GO term are presented via functional enrichment analysis. P-values were adjusted with FDR.

