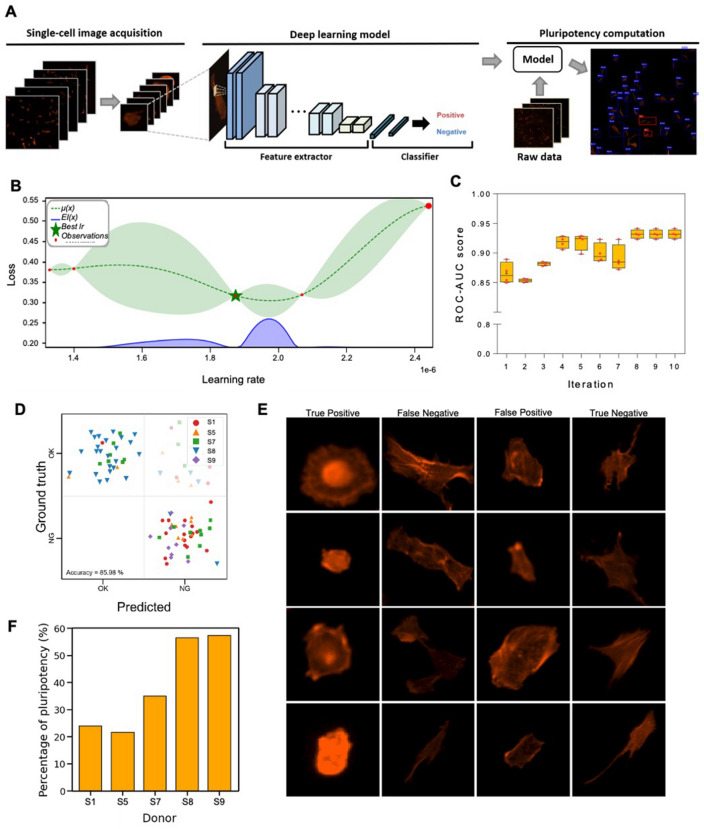
Figure 4.
Deep learning-based multipotency prediction for hNTSCs from different donors. (A) Schematic images presenting the procedure of the proposed deep learning algorithm: single-cell image acquisition (preprocessing), deep learning model, and multipotency computation. (B) Bayesian optimization for learning rate: the results are visualized as a probabilistic model of the loss function (dotted line), uncertainty at each point (green region), and expected improvement (EI) for expensive optimization problems (blue region). (C) ROC-AUC score plotted over 10 iterations according to Bayesian optimization. (D) Confusion matrix: Predicted (x-axis) represents results through the deep learning; ground truth (y-axis) represents multipotency data revealed by immunofluorescence staining of SSEA3, and deep learning distinguishes cells with high/low multipotency. (E) Classification results of the proposed CNN model. (F) Ratio corresponding to the multipotent stem cell for each donor.

