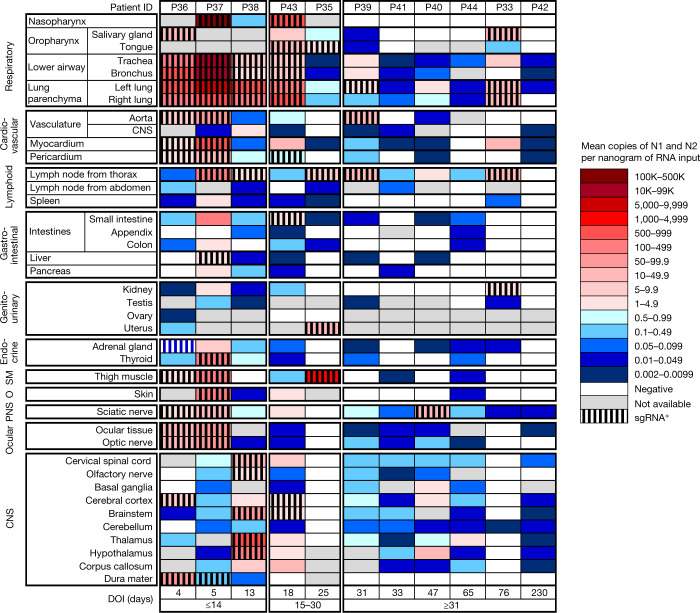
Fig. 1. Distribution, quantification and replication of SARS-CoV-2 across the human body and brain.
The heat map depicts the highest mean quantification of SARS-CoV-2 RNA (N) through ddPCR present in the autopsy tissues of 11 patients who died with COVID-19 and underwent whole-body and brain sampling. Patients are aligned from shortest to longest duration of illness (DOI) before death, listed at the bottom of the figure, and grouped into early (≤14 days), mid (15–30 days) and late (≥31 days) duration of illness. Tissues are organized by tissue group beginning with the respiratory tissues at the top and CNS at the bottom. Viral RNA levels range from 0.002 to 500,000 N gene copies per nanogram of RNA input, depicted as a gradient from dark blue at the lowest level to dark red at the highest level. Tissues that were also positive for subgenomic RNA (sgRNA+) through real-time RT–qPCR are shaded with black vertical bars. O, other; PNS, peripheral nervous system; SM, skeletal muscle.

