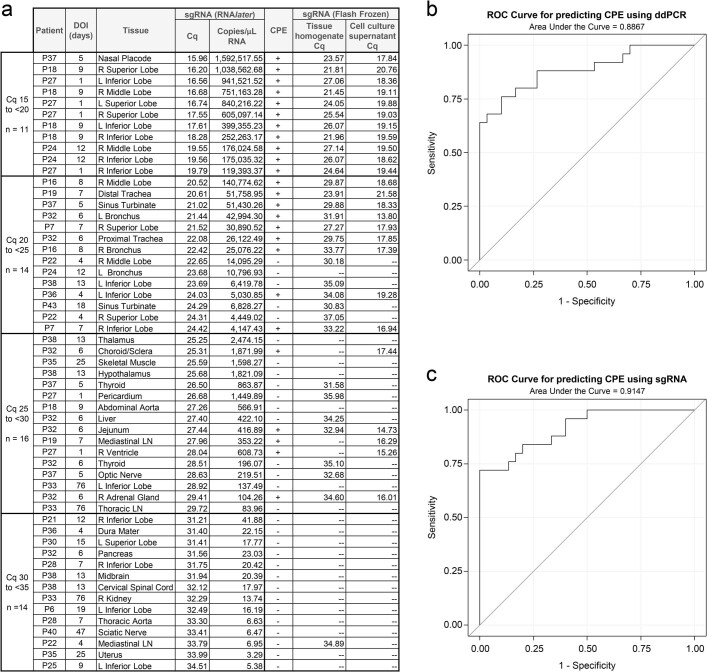
Extended Data Fig. 3. Virus isolation summary and correlation between ddPCR and sgRNA.
(a) Summary of 55 tissues selected for virus isolation organized by the sgRNA qPCR quantification cycle (Cq) for the RNAlater preserved tissue, (b) Receiver operating characteristic (ROC) curve of logistic regression using log10ddPCR to predict the presence of cytopathic effect (CPE), area under the curve 0.887 (95% CI 0.795, 0.978), optimal cut-off for ddPCR is 758 N copies/ng RNA (sensitivity 76%, specificity 90%), (c) ROC curve of logistic regression using log10sgRNA to predict presence of CPE, area under the curve 0.915 (95% CI 0.843, 0.987), optimal cut-off for sgRNA is 25,069 copies/µL RNA (sensitivity 72%, specificity 100%). sgRNA qPCR was additionally performed on the flash frozen tissue homogenate and the supernatant from the least diluted tissue culture wells with CPE in order to rule out CPE from other causes; if both wells at that dilution showed CPE the samples were pooled.

