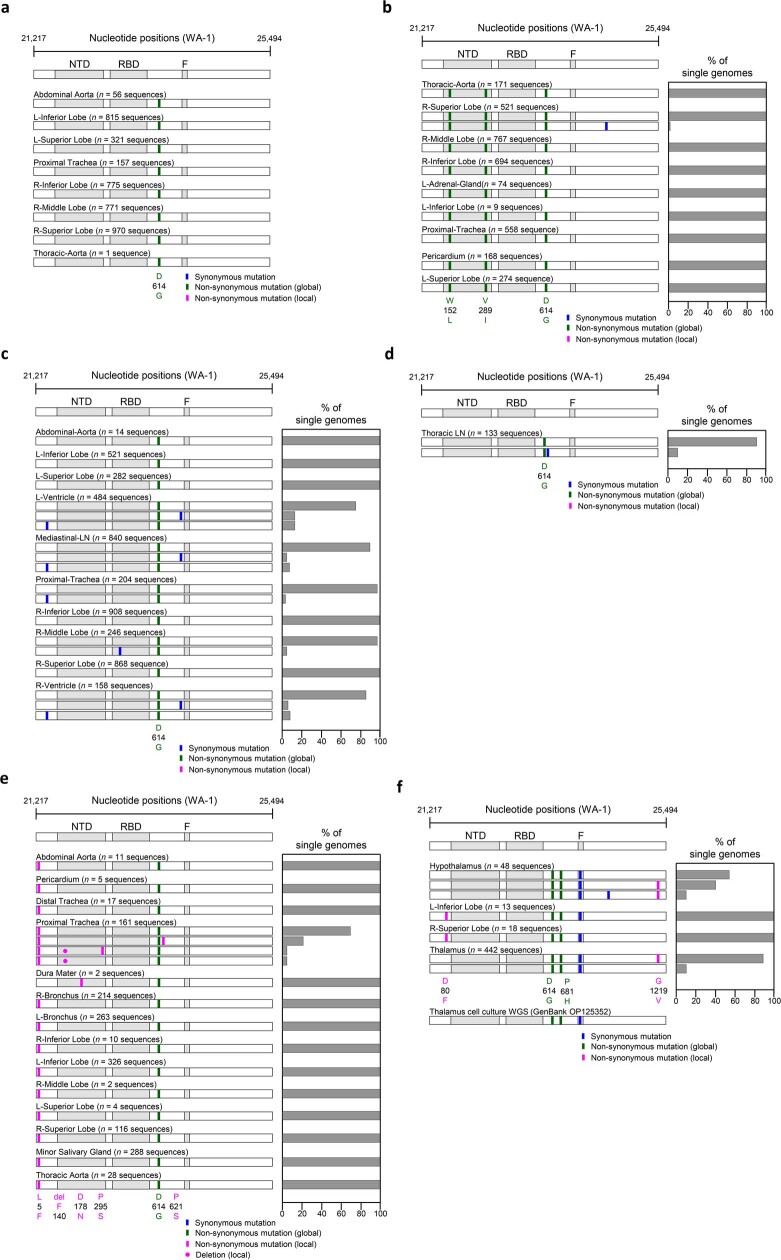
Extended Data Fig. 4. Analysis of SARS-CoV-2 genetic diversity across body compartments in patients.
(a) P18, (b) P19, (c) P27, (d) P33, (e) P36, (f) P38. Haplotype diagrams (left) show SARS-CoV-2 spike single genome sequences detected in multiple organs. Spike NH2-terminal domain (NTD), receptor-binding domain (RBD), and furin cleavage site (F) regions are shaded grey, and remaining regions of the spike are shaded white. Ticks with different colors indicate mutations relative to the WA-1 reference sequence; green indicates non-synonymous differences from WA-1 detected in all sequences in the individual; blue indicates synonymous mutations detected variably within the individual, and pink indicates non-synonymous mutations detected variably within the individual. Bar graphs (right) show the percentage of all single genome sequences in the sample matching each haplotype. The spike region of the consensus sequence generated from short read, whole genome sequencing (WGS) of the supernatant of P38 thalamus frozen tissue on Vero E6-TMPRSS2-T2A-ACE2 cells is additional shown at the bottom of (f) for comparison.

