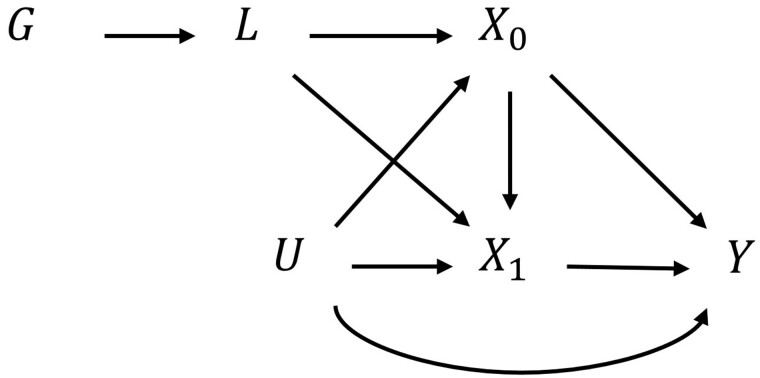
Figure 1.
Causal diagram showing two exposures and one outcome
, genetic instrument; , liability; , exposure measured at time 0; , exposure measured at time 1; , outcome; , confounder. Other sources of variability in the liability, exposures and outcome are not shown in this diagram. There is a problem of under-identification here in that the direct effects of or on cannot be estimated with a single liability ().

