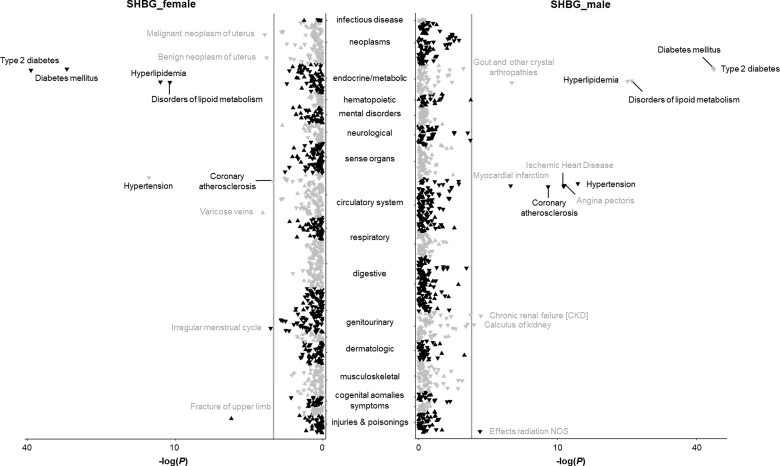
Figure 2.
Associations of genetically predicted sex hormone-binding globulin (SHBG) levels with clinical outcomes and biomarkers in the phenome-wide association analysis in the UK Biobank. NOS indicates not other specified. The y-axes correspond to the logarithms of the P-values derived from the phenome-wide association analyses. The grey lines correspond to the statistical significance level (false discovery rate <0.05). Associations surviving the significance criteria are labelled by name. Associations that are found in females and males combined are labelled in black, whereas associations that are revealed in females or males are labelled in grey. The triangle facing up represents a positive association, otherwise an inverse association

