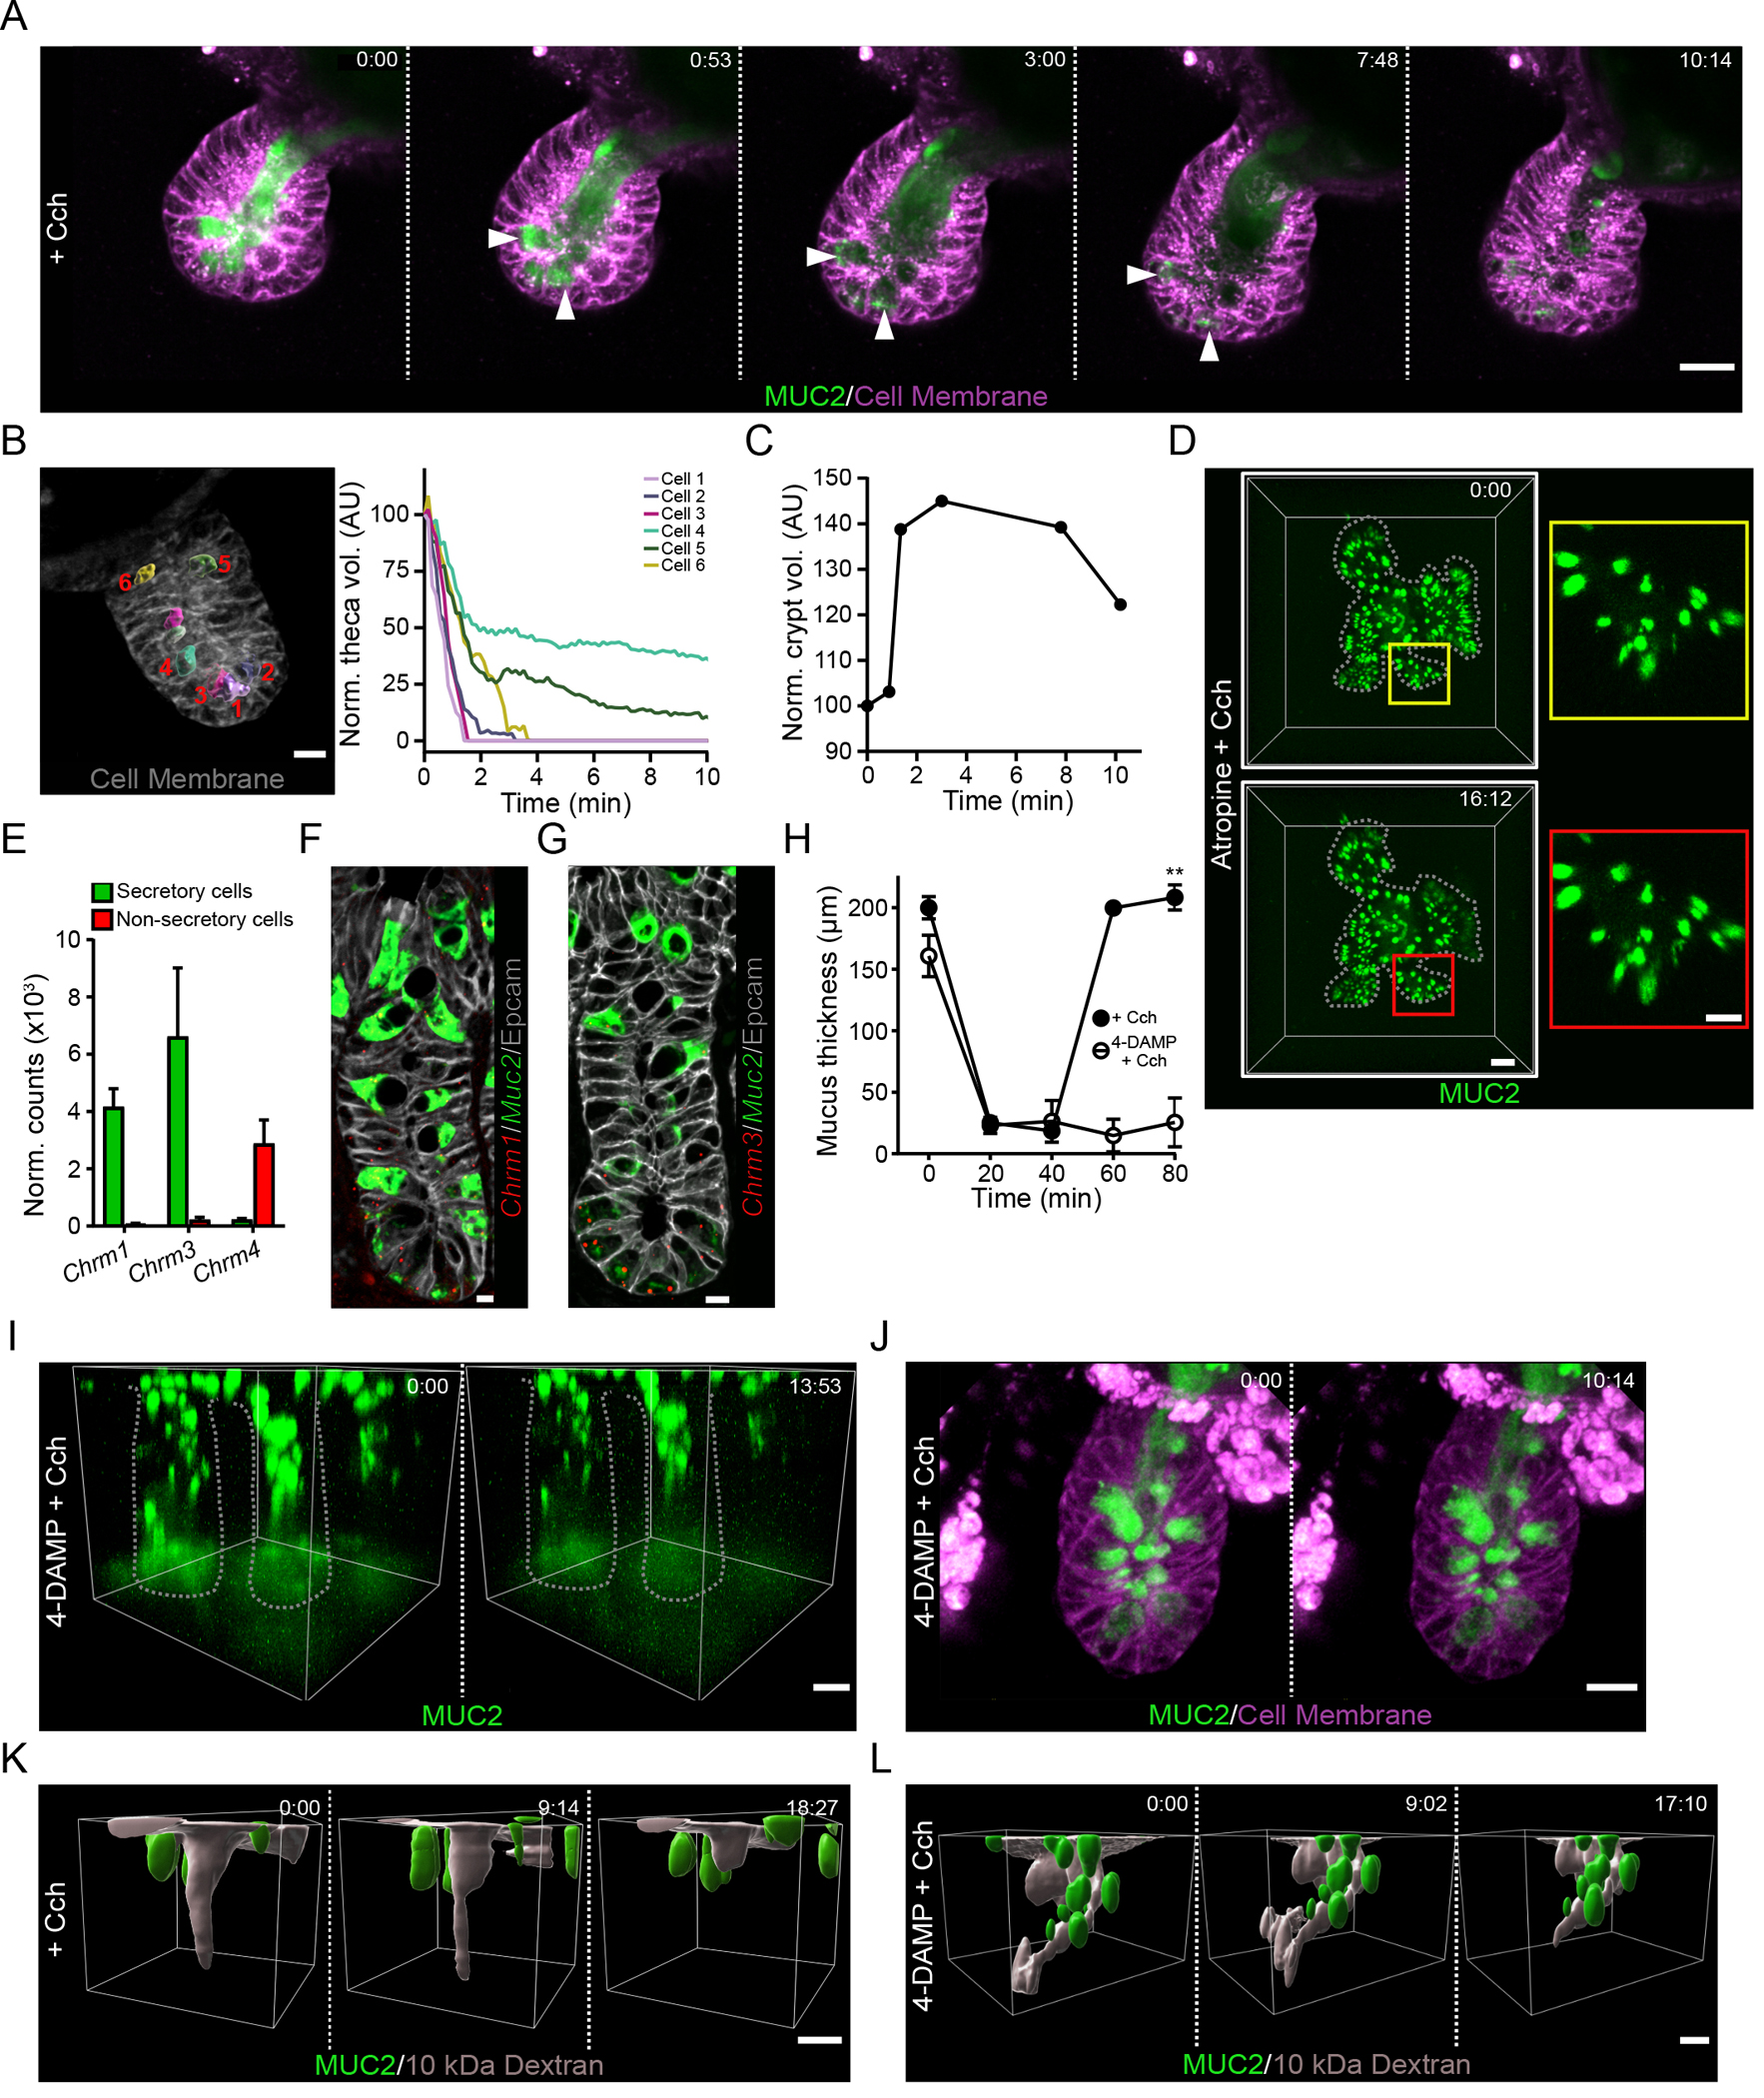
Fig. 2. The cholinergic secretory response flushes the crypt lumen.

(A) Live cell imaging of an organoid generated from RedMUC298tr mice and stimulated with carbachol (Cch) at time 0. White arrowheads indicate Cch-responsive mCherry-MUC2+ goblet cells. Scale bar, 20 μm. Images are representative of n = 5 independent experiments. (B) Analysis of goblet cell theca volume after stimulation of an ileal organoid with Cch. The image shows a representative crypt at time 0 with theca highlighted in individual numbered goblet cells using iso-surface analysis. Scale bar, 10 μm. The graph displays tracking of theca volumes of the individual cells after stimulation and normalized to the volume at time 0. Image is representative of 3 independent experiments. (C) Quantification of crypt volume by iso-surface analysis in an organoid stimulated with Cch at time 0. Data are representative of 3 independent experiments. (D) Live confocal imaging of an ileal organoid stimulated with Cch at time 0 in the presence of the muscarinic receptor antagonist atropine. Scale bar, 50 μm (main images) and 20 μm (insets). Images are representative of n = 3 independent experiments. (E) RNA-seq analysis of expression of transcripts encoding muscarinic acetylcholine receptors in the small intestine from published RNA-seq data (13). (F and G) RNAscope analysis of Muc2 and Chrm1 (F) or Chrm3 (G) in the mouse ileal crypt. Scale bar, 5 μm. Images are representative of 3 independent experiments. (H) Mucus thickness in small intestine explants stimulated with Cch in the absence or presence of the M3-selective antagonist 4-DAMP. Mucus was removed from the tissue at 20 min, and Cch stimulation was performed at 40 min. Data presented as mean ± SD. (n = 5 independent experiments; ** P < 0.01, Mann-Whitney test). (I) Live tissue multi-photon imaging of MUC2 in crypts of ileal explants from RedMUC298tr mice that were pretreated with 4-DAMP before stimulation with Cch. The low fluorescence at the base of the crypt is due to photobleaching. Scale bar, 20 μm. Data are representative of n = 3 independent experiments. (J) Live cell imaging of RedMUC298tr organoid crypt following treatment with 4-DAMP and stimulation with Cch. Scale bar ,20 μm Images are representative of n = 3 independent experiments. (K and L) Live tissue imaging of Cch-induced ileal crypt flushing in tissue explanted from RedMUC298tr mice, labelled with soluble fluorescent dextran, and stimulated with Cch without (K) or with (L) 4-DAMP pretreatment. Scale bar, 20 μm. Images are representative of n = 3 independent experiments.
