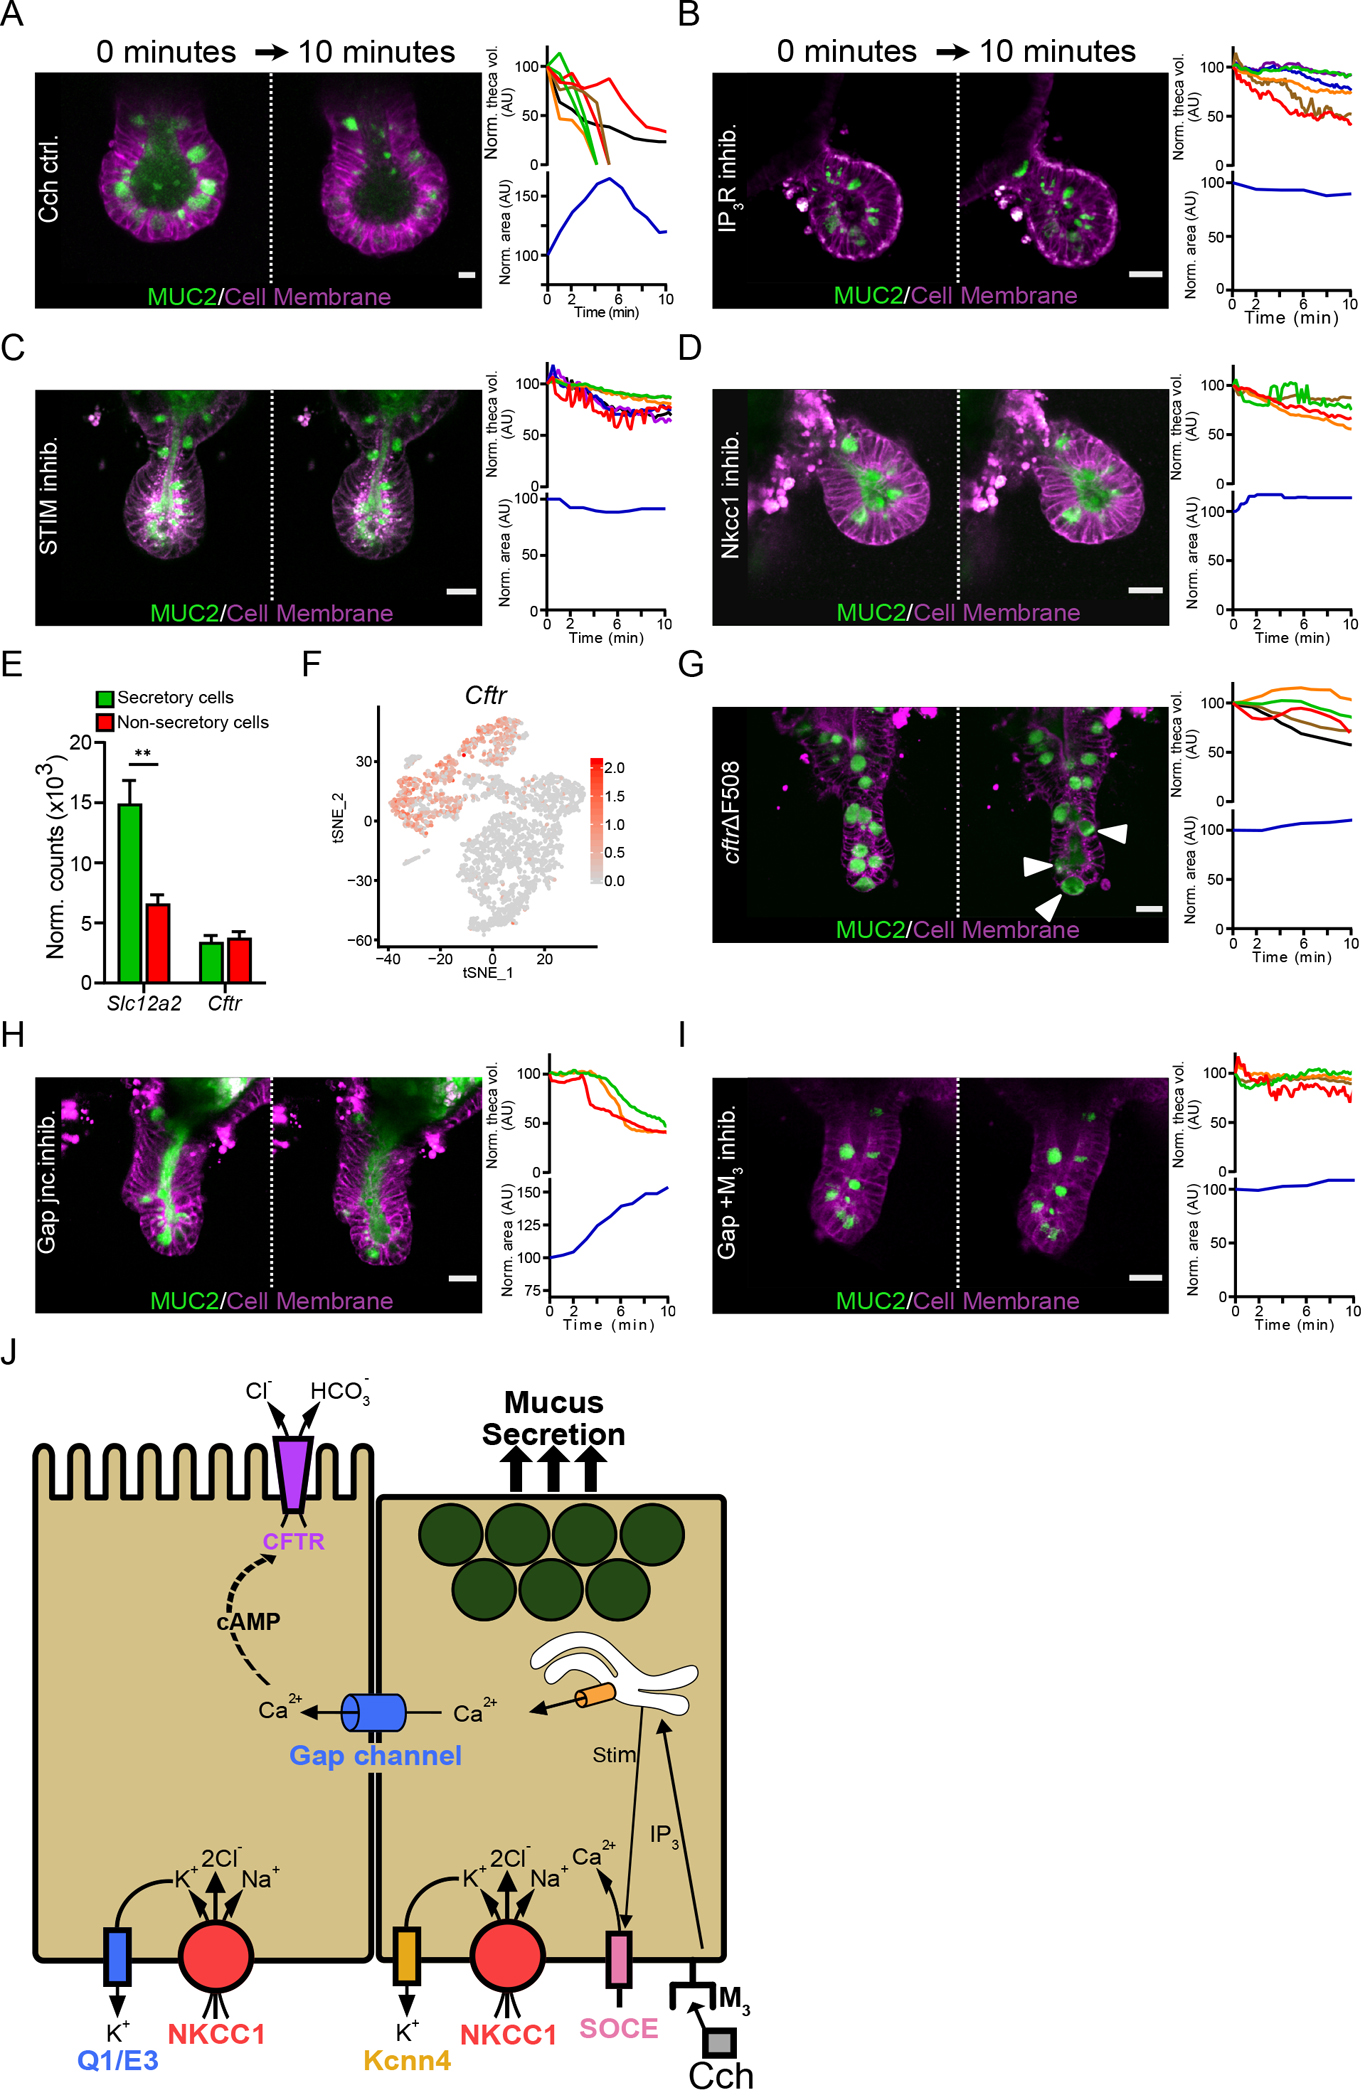
Fig. 3. Cholinergic stimulation induces a coordinated mucus and fluid secretory response.

(A) Live cell imaging of RedMUC298tr organoid crypts following stimulation with Cch. The graphs show quantification of theca volume for individual goblet cells and the crypt lumen area measurements with respect to time. Scale bar, 10 μm. (B to D) Live cell imaging and quantification of goblet cell theca volume and crypt volume in RedMUC298tr organoid crypts stimulated with Cch after pretreatment with the IP3R inhibitor Xestospongin C (B), the STIM inhibitor SKF 96365 (C), or the Nkcc1 inhibitor Bumetanide (D). Scale bars, 20 μm. Images in (A) to (D) are representative of n = 3 independent experiments. (E) Quantification of Slc12a2 and Cftr expression in the small intestinal epithelium from published RNA-seq data (13) (** P < 0.01, Welch’s test). (F) Single-cell mRNA cluster analysis of Cftr expression in small intestinal goblet cells from published single-cell RNA-seq data (13). (G to I) Live cell imaging of RedMUC298TR/CftrΔF508 organoids stimulated with Cch (G) or stimulated with Cch after pretreatment with the gap junction inhibitor carbenoxolone (H) or carbenoxolone plus the M3 receptor antagonist 4-DAMP (I). Scale bars, 20 μm. Images in (G) to (I) are representative of n = 3 independent experiments. (J) Graphical summary of the role of Ca2+ signaling, gap channel cell-to-cell communication, and ion transport on mucus secretion.
