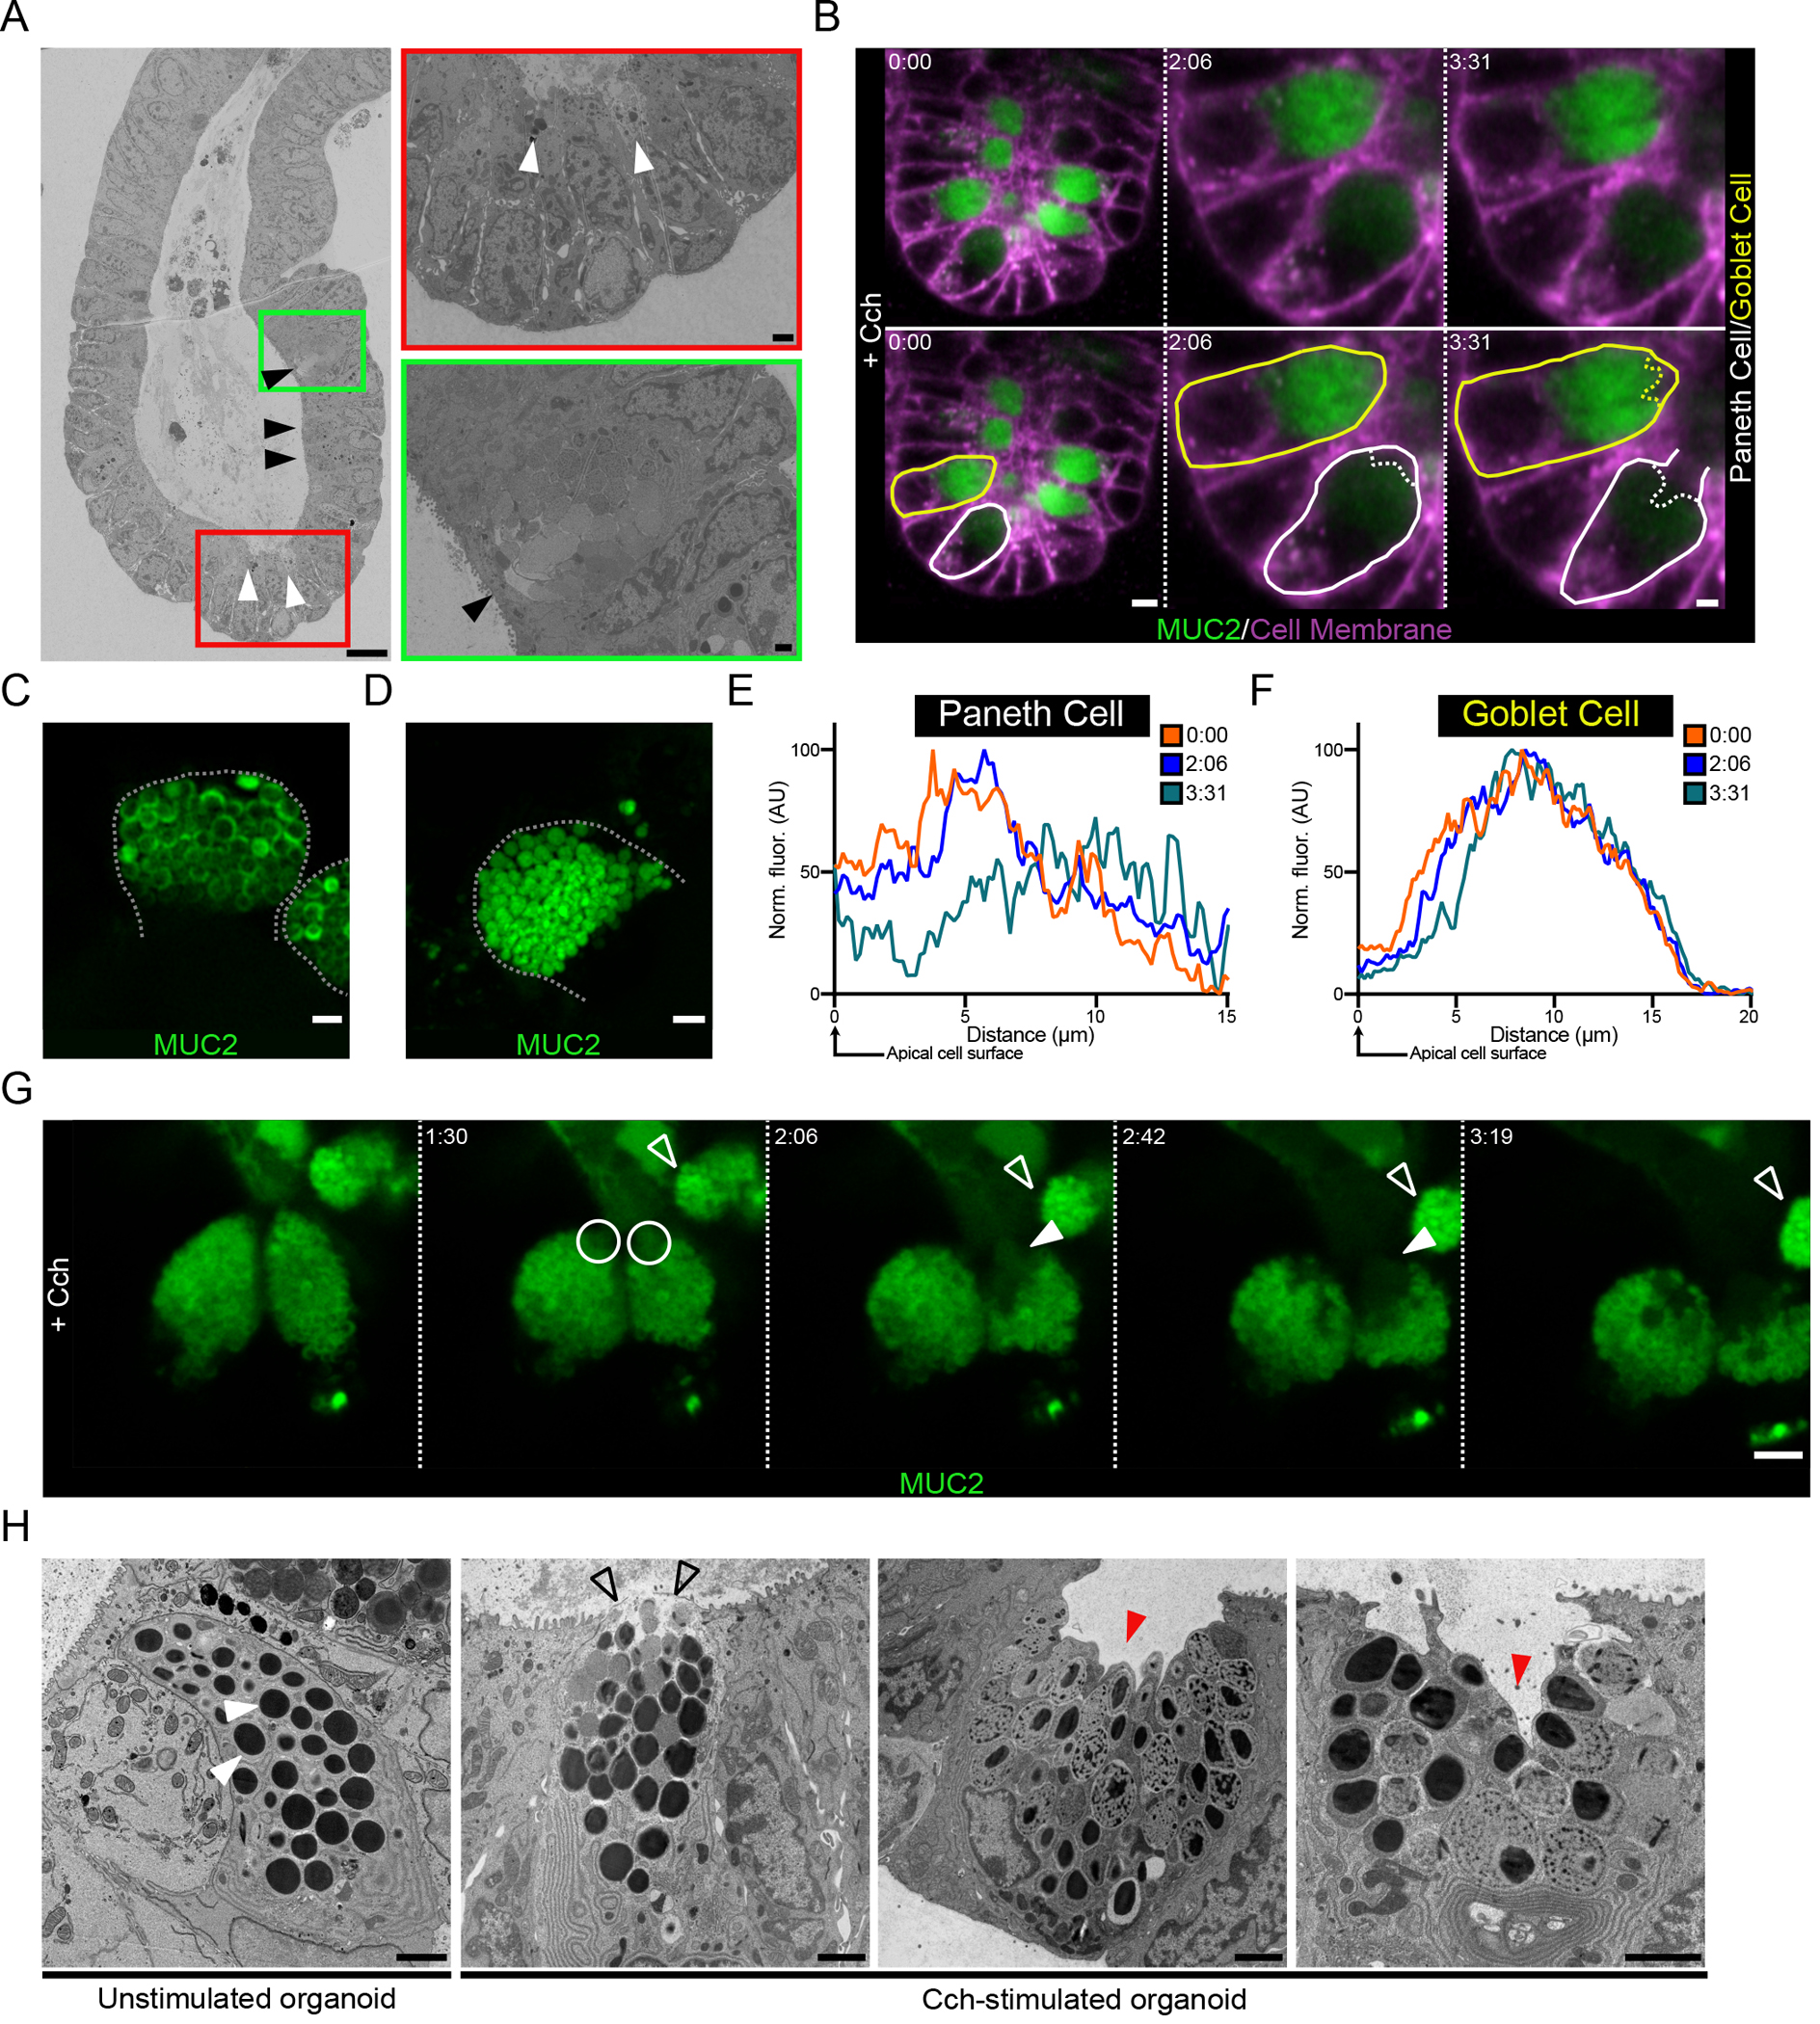
Fig. 4. The crypt secretory response to cholinergic stimulation occurs in an ordered manner.

(A) Scanning electron micrograph of a crypt from a Cch-stimulated organoid. Paneth cells are indicated by white arrowheads, and goblet cells are indicated by black arrowheads. Scale bars, 10 μm (main image), 1 μm (red inset), 2 μm (green inset). Images are representative of 3 independent experiments. (B) Live cell imaging of a RedMUC298TR organoid crypt base following cholinergic stimulation. Images are shown in duplicate with no labelling and with goblet (yellow) and Paneth (white) cells outlined. Scale bars, 10 μm (Time 0:00) and 5 μm (Time 2:06 & 3:31). Images are representative of 3 independent experiments. (C and D) High-resolution image of Paneth cell (C) and goblet cell (D) secretory granules in a RedMUC298TR organoid. Scale bar, 2 μm. Images are representative of 3 independent experiments. (E and F) Line profile quantification of theca fluorescence of the Paneth cell (E) and goblet cell (F) outlined in (B) following Cch stimulation. Data are representative of 3 independent experiments. (G) High-resolution live cell imaging of organoid Paneth cell following Cch stimulation. White circles and closed arrowheads highlight secretion of material from Paneth cells. Open arrowhead highlights adjacent goblet cell. Scale bar 5 μm. Images are representative of n = 3 independent experiments. (H) Electron micrographs of Paneth cells from unstimulated and Cch-stimulated organoids. White arrowheads indicate resting Paneth cell granules. Open arrowheads highlight release of apical granules. Red arrowheads indicate retention of basal secretory granules. Scale bars, 2 μm. Images are representative of 3 independent experiments.
