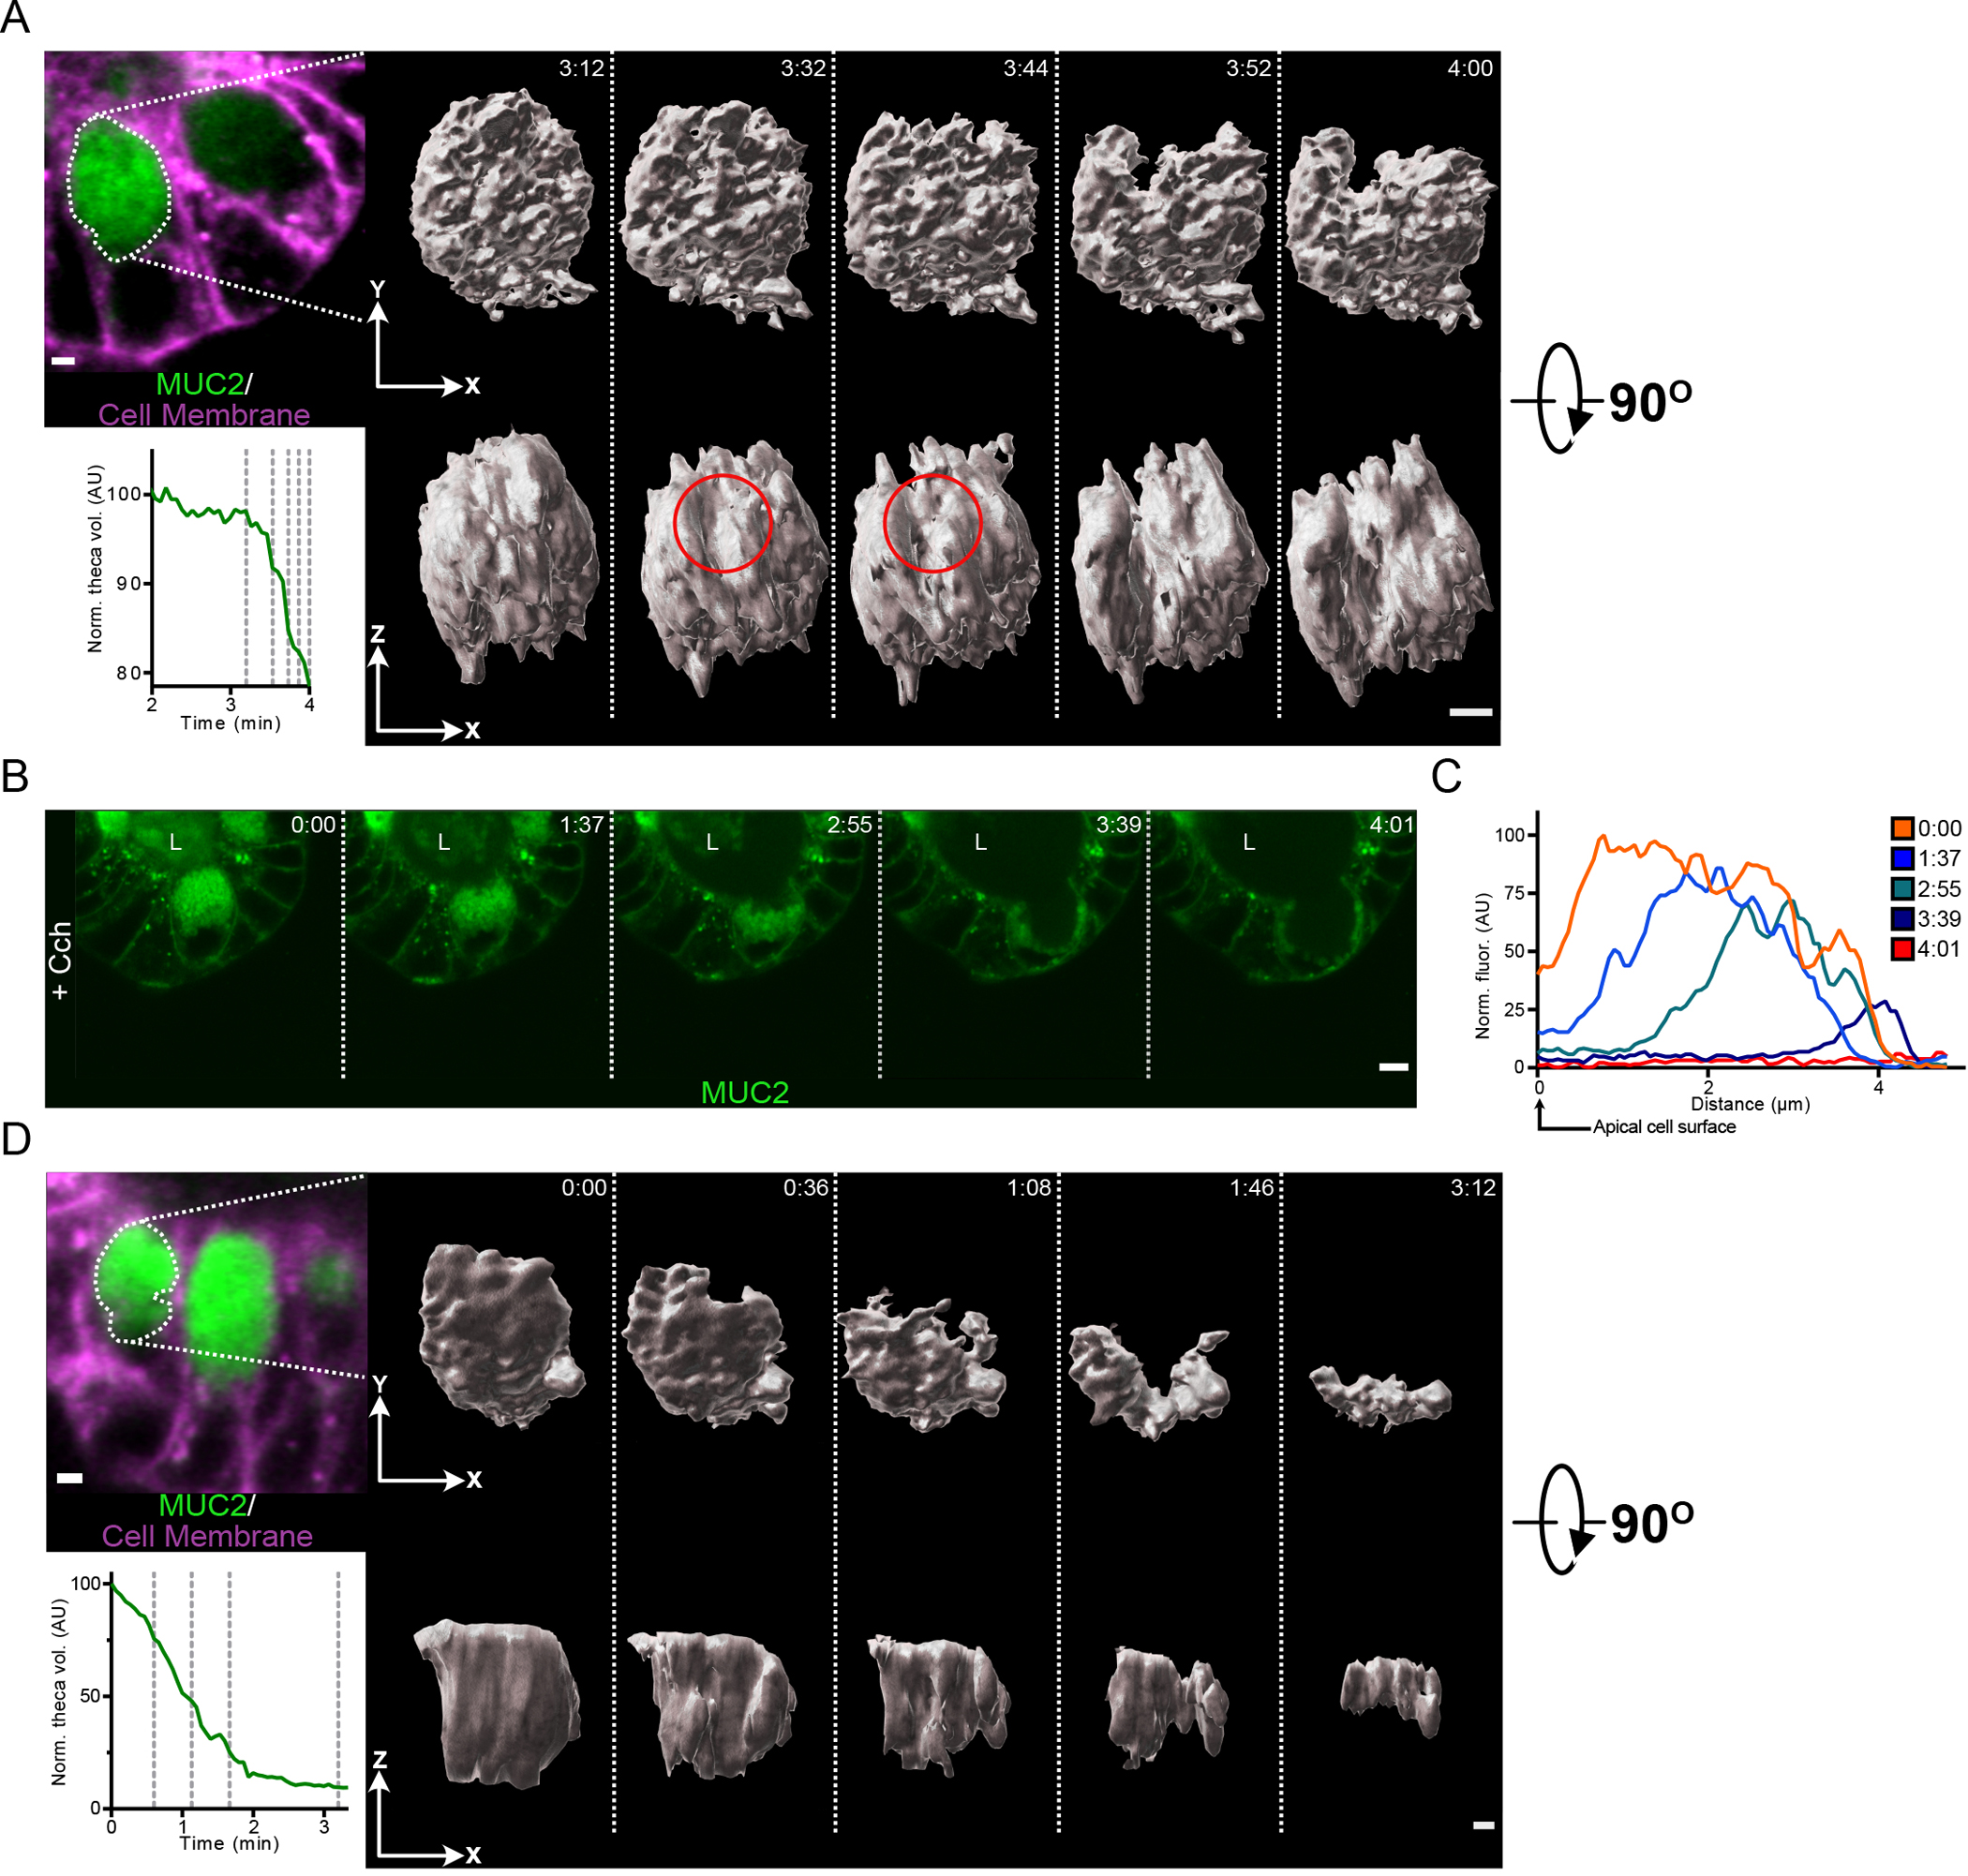
Fig. 5. Granules in the goblet cell theca are secreted in an ordered manner in response to Cch stimulation.

(A) Micrograph shows a goblet cell of a RedMUC298TR organoid prior to Cch treatment with the theca outlined. Graph displays the normalized theca volume of the highlighted goblet cell during the initiation of secretion following Cch stimulation. The vertical dashed lines in the graph indicate the time points for which iso-surface reconstructions of the goblet cell theca are shown. The red circle indicates the region within the theca where the secretory response initiates. Scale bar, 2 μm. Data are representative of 3 independent experiments. (B) High-resolution live cell imaging of a RedMUC298TR organoid crypt goblet cell after Cch stimulation. L, crypt lumen. Images are representative of n = 3 independent experiments. Scale bar, 5 μm. (C) Line profile quantification of theca fluorescence of goblet cell shown in panel (B) following Cch stimulation. (D) Micrograph shows a goblet cell of a RedMUC298TR organoid prior to Cch treatment with the theca outlined. Graph displays the normalized theca volume of the highlighted goblet cell throughout the secretory event following cholinergic stimulation. The vertical dashed lines in the graph indicate the time points for which iso-surface reconstructions of the goblet cell theca are shown. Scale bar, 2 μm. Data are representative of 3 independent experiments.
