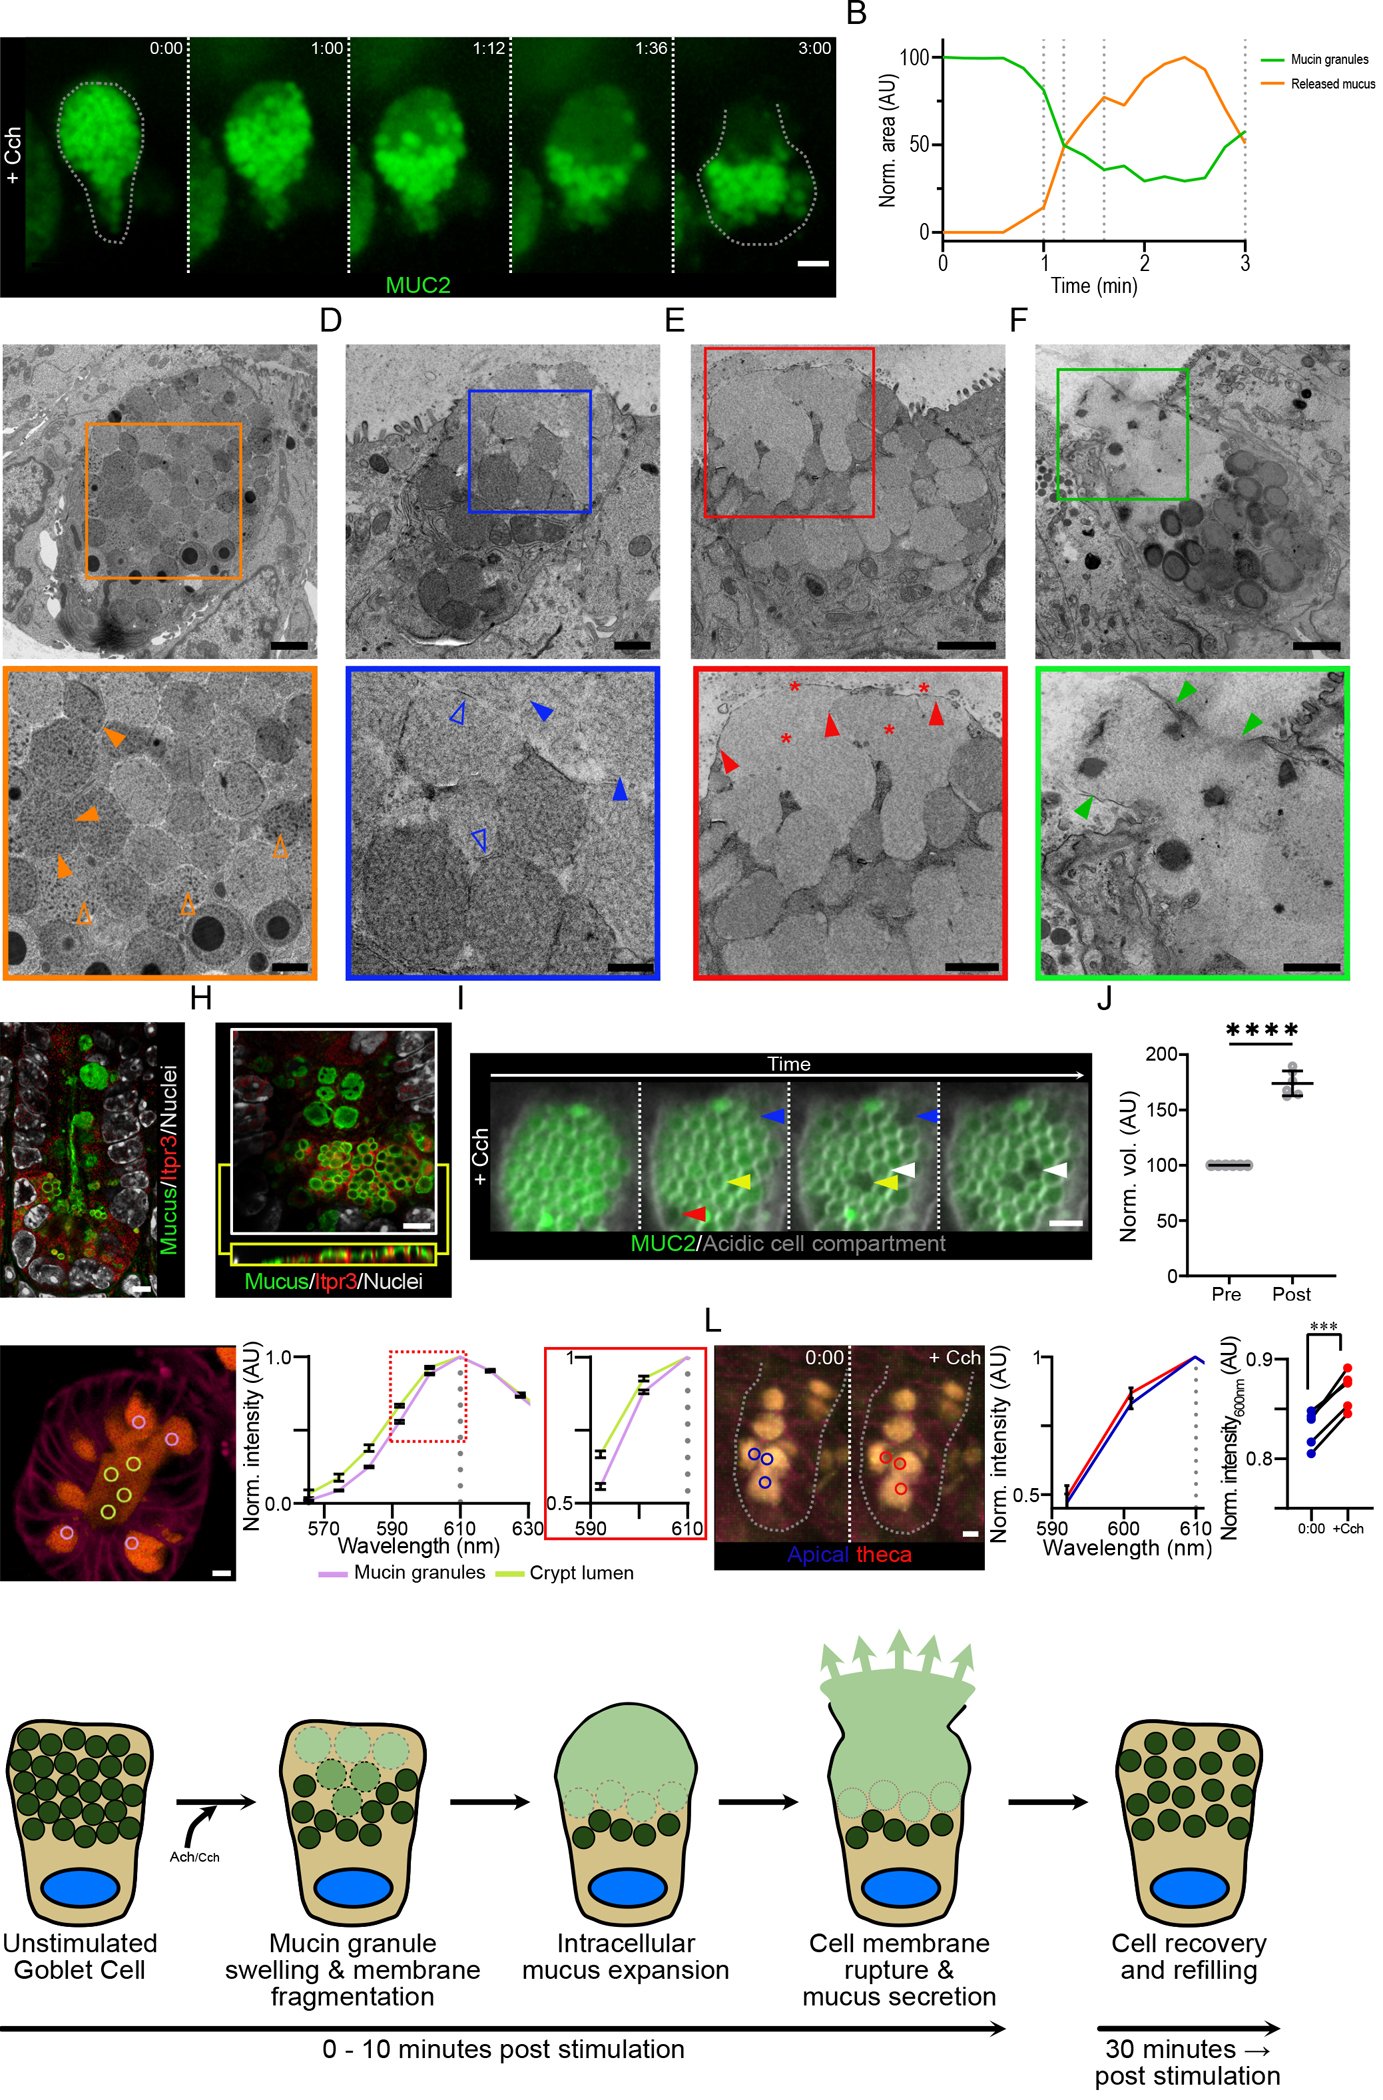
Fig. 6. The goblet cell secretory response to Cch involves the intracellular release of mucin granule contents prior to the secretion of mucus.

(A) High resolution live cell imaging of crypt goblet cell in a RedMUC298TR organoid in response to Cch stimulation. Dashed lines images indicate the cell border. Scale bar, 5 μm. Data are representative of n = 3 independent experiments. (B) Fluorescence quantification of mucin granules and intracellular mucus in the cell in (A). (C) Transmission electron micrograph of a goblet cell from an unstimulated small intestine organoid. Closed orange arrowheads highlight inter-granule membrane interactions, and open orange arrowheads indicate condensed intra-granule mucus material. Scale bars, 2 μm (main image) and 1 μm (inset). (D to F) Transmission electron micrographs of Cch-stimulated organoid goblet cells. Closed blue arrowheads highlight the expansion of granule material, and open blue arrowheads indicate the presence of fragmented granule membranes (D). Closed red arrowheads highlight the presence of an intact apical cell membrane, and red stars indicate the presence of expanded mucus material (E). Closed green arrowheads highlight the disruption of the apical cell membrane during the exocytosis of mucus from the goblet cell (F). Scale bars, 1 μm (main image D) and 500 nm (inset D), 2 μm (main image E & F) and 1 μm (inset E & F). Images in (c) to (F) are representative of 3 independent experiments. (G) Confocal micrograph of small intestinal crypt stained for Itpr3, mucus, and nuclear counterstain. Mucus was stained with Alexa Fluor 647 conjugated wheat germ agglutin (WGA), which binds strongly to the highly glycosylated mucin glycoproteins. Scale bar, 5 μm. Image is representative of 3 independent experiments. (H) High resolution confocal micrograph of crypt bottom stained for Itpr3, mucus, and nuclear counterstain. An X/Y-axis cross section (white box) and an X/Z-axis cross section (yellow box) are shown. Scale bar, 5 μm. Image is representative of 3 independent experiments. (I) Live cell imaging of organoid goblet cell theca pretreated with LysoSensor Green dye (grey) before Cch stimulation. Arrowheads highlight mucin granules before and after expansion. Scale bar, 2 μm. Images are representative of n = 3 independent experiments. (J) Quantification of change in granule volume in cells treated as in (I) (**** p <0.001, paired t-test of log transformed values, n = 3 independent experiments) (K) Spectral analysis of luminal mucus (yellow circles) and granule mucus (lilac circles) in a resting RedMUC298tr organoid. Image is representative of 3 independent experiments. (L) Spectral analysis of thecal mucus in a RedMUC298tr organoid following stimulation with Cch. Blue circles mark areas in apical theca before stimulation; red circles mark areas in apical theca approximately 1 minute post stimulation. Graphs show mCherry emission spectra (590– 610 nm) before and after Cch stimulation and emission intensity changes at 600 nm in individual goblet cells from one out of three representative experiments (*** p = 0.0005, paired t-test; n = 3). (M) Graphical summary of the steps involved in the crypt goblet cell response to cholinergic stimulation.
