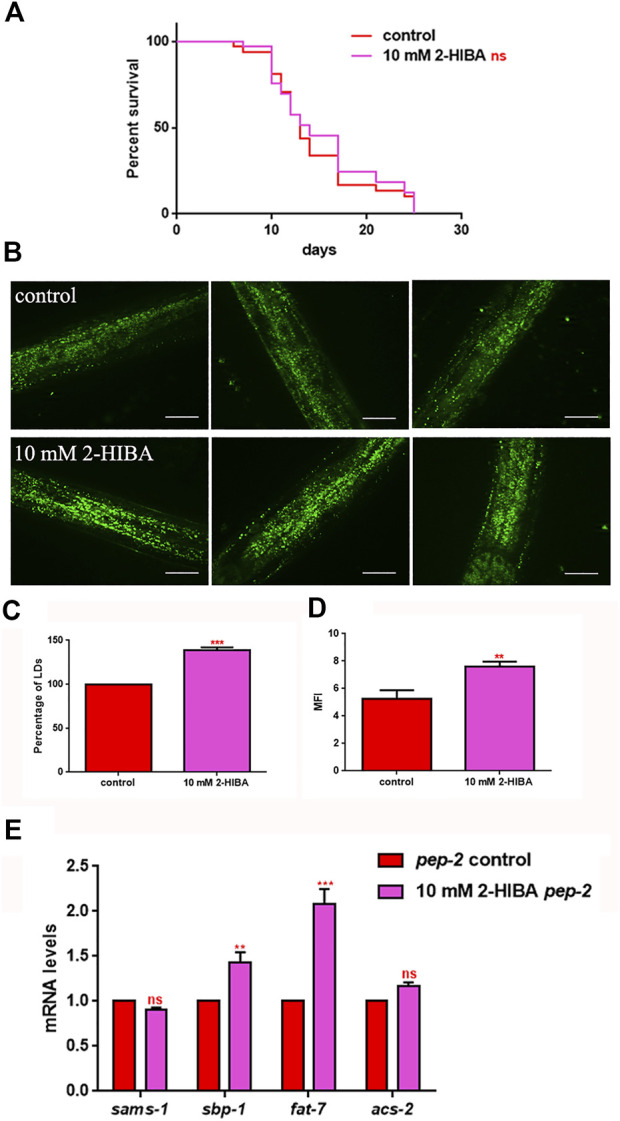
FIGURE 10.

Lifespan analysis and fat accumulation in pep-2 mutants. (A) Kaplan-Meier survival plot of pep-2 mutant worms supplemented with 10 mM 2-HIBA. Lifespans of untreated worms were reported as controls; n = 60 for each data point of single experiments (ns: not significant). The assay was performed in triplicate. (B) BODIPY staining of 1 day adult pep-2 worms treated or not with 10 mM 2-HIBA. Scale bar = 50 μm. (C) Percentage of Lipid Droplets (LDs) and (D) Mean Fluorescence Intensity (MFI) of fat accumulation observed by BODIPY staining. Statistical analysis was evaluated by one-way ANOVA with the Bonferroni post-test; asterisks indicate significant differences (**p < 0.01, ***p < 0.001). Bars represent the mean of three independent experiments. (E) Expression of sams-1, sbp-1, fat-7, and acs-2 genes in 10 mM 2-HIBA-fed 1 day adults. Histograms show the transcript levels of genes involved in lipid metabolism in pep-2 mutants, supplemented with 10 mM 2-HIBA, as compared to untreated control. Experiments were performed in triplicate. Data are presented as mean ± SD (***p < 0.001, ns: not significant).
