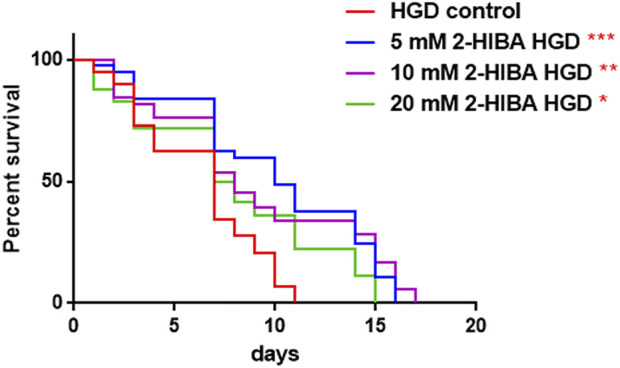
FIGURE 11.

Effect of 2-HIBA on HGD wild-type worms (A) Kaplan–Mèier survival plot of HGD worms treated or not with 2-HIBA at different concentrations (control: untreated). n = 60 for each data point of single experiments. Bars represent the mean of three independent experiments. Asterisks indicate the p-values (log-rank test) with respect to the untreated control (*p < 0.05, **p < 0.01, ***p < 0.001).
