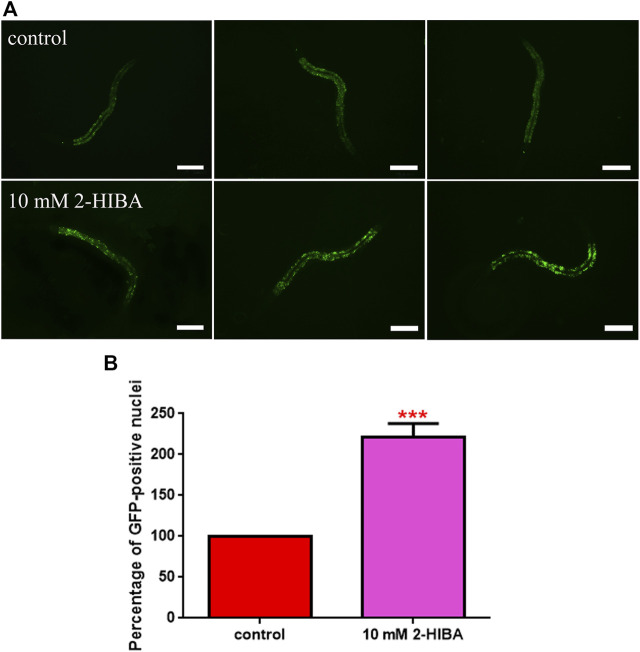
FIGURE 6.
Fluorescence analysis of skn-1::GFP transgenic strain. (A) Effect of 10 mM 2-HIBA treatment on localization of SKN-1 transcriptional factor and (B) respective Mean Fluorescence Intensity evaluation. Scale bar = 100 μm. Data were obtained from three independent experiments (60 worms for each condition). control: untreated worms. Statistical analysis was performed by one-way ANOVA with the Bonferroni post-test; asterisks indicate significant differences (***p < 0.001). Bars represent the mean of three independent experiments.

