

Abstract

The heterogeneity of pore structure in coal reservoir is extremely complex. In this paper, mercury intrusion porosimetry (MIP) and liquid nitrogen adsorption (LNA) were used to describe pore characteristics of macro-coal components, and the fractal characteristics of pores and their relationship with adsorption and desorption were discussed. The findings revealed that there were obvious differences in pore characteristics of different macro-coal components at different pore sizes. The total pore volume of vitrain and durain was equivalent, and the total specific surface area was larger than durain, indicating that the micropores in vitrain were more developed, while the macropores in durain were more developed, indicating that the specific surface area was smaller. Fractal results indicated that the pore structure of coal was more complex with the increase of pore diameter. The Da1 and Da2 of vitrain and durain were affected by larger specific surface area and pore volume. The Ds of vitrain increased first and then decreased with the content of vitrinite, while that of durain was the opposite. The relationship between the adsorption capacity of vitrain and fractal dimension Da1 was binomial distribution, and it was positively correlated with Da2. The adsorption capacity of durain samples increased first and then decreased with Da1. With the increase of fractal dimension Ds, the theoretical desorption rate and recovery rate of durain had a downward trend, that is, the more complex the pore structure, the poor the desorption efficiency.
1. Introduction
Coalbed methane (CBM) is an essential clean energy and an influential supplement of national oil and gas resources and has received widespread attention around the world.1−3 Coal seams are naturally fractured reservoirs composed of matrix blocks. The pore structure is complex and the gas is mainly absorbed in micropores.4−7 The different macro-coal components and material composition have an obvious influence on the pore type and pore connectivity of coal reservoir as well as the enrichment and exploitation of coalbed methane.8−14 At present, advanced laboratory techniques, such as scanning electron microscopy (SEM), nuclear magnetic resonance (NMR), low-temperature adsorption isotherm, and mercury porosimetry, are mainly used to study pore structure characteristics.15−27 However, it is difficult to accurately and quantitatively characterize the heterogeneity of coal reservoirs by conventional methods, and fractal theory provides a different idea for quantitative characterization of the complex pore structure of coal reservoirs.
In fact, the research studies on pore fractal characteristics of coal reservoir had achieved remarkable results. For coal with different degrees of coalification, it was found that the higher the fractal dimension D1, the larger the adsorption space of CH4. The higher the fractal dimension D2, the stronger the heterogeneity of pore structure, and the higher the liquid/gas surface tension, the lower the CH4 adsorption capacity.26,27 The more irregular the surface of coal, the more uneven the pore structure, and the greater the surface area, the stronger the adsorption capacity. For bituminous and sub-bituminous coals, macropores have a significant effect on gas flow.28 Studies have shown that Ds is positively correlated with specific surface area and negatively correlated with median pore size. In addition, Ds is also affected by coal rank and maceral content. When the coal rank increases from low to high, the fractal dimension is positively correlated with mineral content and negatively correlated with vitrinite content, and decreases with the increase of carbon and hydrogen content and the decrease of ash yield.16,29−31 Compared with the pore genetic type, pore shape, pore surface roughness, pore size distribution, specific surface area, total pore volume, physical properties, and CH4 adsorption capacity of different samples, it is considered that the carbon content and pore size are the main factors determining the surface fractal dimension.32 The three-dimensional structure of coal was reconstructed by computed tomography (CT) images and studied the influence of a real coal pore structure on fluid flow in coal. Based on the reconstructed coal structure, the microscale structural parameter was quantitatively analyzed33 and obtained the relationship between porosity/permeability and volume fractal dimension.34
Previous research mainly focuses on the relationship between pore characteristics and adsorption/desorption of coal reservoir, but the influence of pore fractal characteristics of different macro-coal components on adsorption/desorption is hardly discussed.35,36 In this paper, fractal theory was used to discuss the different macro-coal components’ pore structure characteristics of low-rank coal in the Huanglong coalfield and their effects on adsorption/desorption. The findings of this study will enrich the theoretical approach on adsorption and desorption in CBM reservoirs.
2. Geological Setting
Huanglong coalfield is located in the southwest margin of Ordos Basin, which is divided into five mining areas from west to east, namely, Yonglong mining area, Binchang mining area, Xunyao mining area, Jiaoping mining area, and Huangling mining area (Figure 1). The total area of the coalfield is about 8000 km2, and the coal-bearing area is nearly 5800 km2. The structural morphology of the coalfield is generally shown as a monocline with a gentle dip in the northwest, and the secondary structures are mainly wide, slow, and discontinuous folds. The overall fault structure is not developed and is only developed in Longxian area, the western edge of the coalfield. Huangling ore area and Binchang ore area are mainly developed near east–west secondary fold structure, simple structure, fault development, or not obvious. The coal-bearing strata are mainly The Middle Jurassic Yan’an Formation, with 1–3 layers of coal seams, the maximum thickness of single layer is 43 m, and the thickness is generally 2–10 m. Yan’an Formation in the Huangling mining area contains 4 layers of coal. The main coal seam is the 4# coal seam with an average thickness of 2.32 m. Yan’an Formation in the Binchang mining area contains 8 layers of coal. The main coal seams are 4# and 4 upper coal seams, with an average thickness of about 10 m.
Figure 1.

Huanglong coalfield location and structural outline map.
3. Experiments and Methods
3.1. Samples and Experiments
Four coal samples were collected from the Huanglong Jurassic coalfield. According to “Proximate analysis method of coal” (GB/T212-2008)37 and “Method for Determination of Microscopic Coal Rock Type” (GB/T15590-2008),38 the samples were tested for proximate components and microscopic components. An SY1B11 high-pressure pore structure analyzer was used for mercury intrusion porosimetry (MIP). The mercury contact angle with coal was 130°, the surface tension was 0.485 N/m, and the pore diameter was measured from 3 nm to 370 μm. The liquid nitrogen adsorption (LNA) experimental equipment was a JW-BK122 specific surface area tester, and its relative pressure range was between 0.05 and 0.995. Some of the samples used in the experiment are shown in Figure 2.
Figure 2.
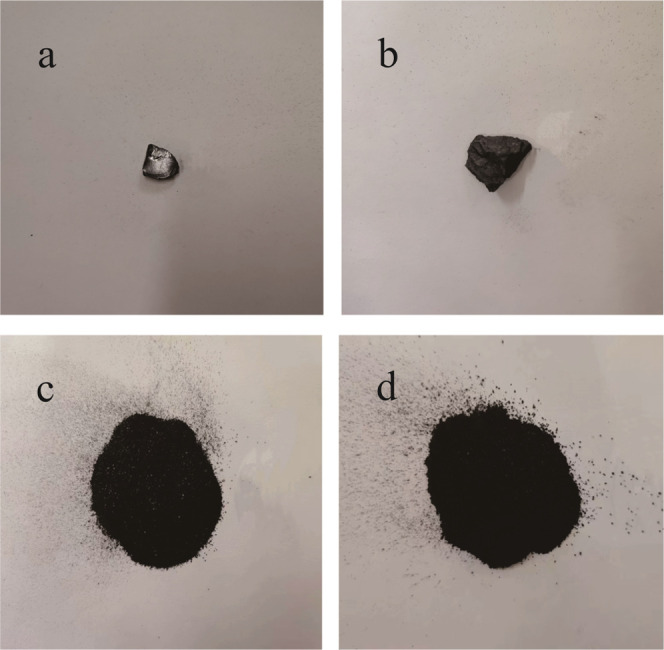
Pictures of some samples used in the experiment: (a, b) MIP test sample of D01 and (c, d) LNA test sample of D01.
The equilibrium moisture content of coal sample preparation was 60–80 coal sample weighing. Distilled water mix was added, supersaturated potassium sulfate solution was put into a dryer, the air pressure within the dryer was set to the vacuum state, the coal sample was weighed every 24 h, and the coal sample quality was recorded after repeating the steps until the continuous sample quality changed less than 2%. Equilibrium moisture content is shown in Table 1.
Table 1. Equilibrium Moisture Content of Different Coal Samples.
| coal sample | equilibrium moisture content (%) | coal sample | equilibrium moisture content (%) |
|---|---|---|---|
| D01-JM | 8.03 | D01-AM | 6.43 |
| H01-JM | 4.64 | H01-AM | 5.16 |
| D02-JM | 8.01 | D02-AM | 7.65 |
| D03-JM | 7.77 | D03-AM | 8.39 |
The isothermal adsorption/desorption experiment adopted an AST-2000 CBM isothermal adsorption/desorption simulation apparatus. The high-pressure system can withstand the pressure of 25 MPa at most. The experimental schematic diagram is shown in Figure 3.
Figure 3.

Principle of the experimental principle of the 2000 type of coalbed methane adsorption/desorption.
Langmuir eq 1(39) was used to fit the adsorption process. The desorption process had a certain desorption lag.40 Desorption eq 2 was used to fit the adsorption process
| 1 |
where Va is the adsorption capacity under coal reservoir pressure in cm3 g–1, aa is the limit adsorption capacity of coal samples in cm3 g–1, and ba is the comprehensive parameters of adsorption/desorption rate and adsorption heat.
| 2 |
where Vd is the adsorption capacity of methane desorption to p pressure in cm3 g–1, ad is the limit adsorption capacity of the coal sample in cm3 g–1, bd is the comprehensive parameter of adsorption/desorption rate and adsorption heat, and c is the residual adsorption capacity in cm3 g–1.
The theoretical desorption rate of the coal sample13 refers to the ratio between the desorption capacity and saturated adsorption capacity when the pressure is zero in the desorption process, namely
| 3 |
The recovery factor of coalbed methane13 refers to the ratio between the desorption capacity and saturated adsorption capacity when the pressure drops to the abandonment pressure (generally 0.7 MPa), namely
| 4 |
where Cdes is the residual adsorption amount corresponding to the desorption curve at abandonment pressure (mL g–1).
3.2. Fractal Dimension Model
Fractal dimension is an essential characterization parameter of pore structure fractal characteristics, which can be used to describe the irregularity and surface roughness of pores, and is widely used in the research of coal and rock. Seepage and adsorption pores were studied in this paper.
The mercury intrusion method is used to calculate the fractal dimension of coal seepage pores (>100 nm), mainly including the thermodynamic model, Menger sponge model, and Washburn derived equation.41 The Washburn equation42 was adopted in this study to calculate the fractal dimension Ds of seepage pore. The specific method is shown in eqs 5 and 6
| 5 |
| 6 |
where S is the mercury saturation corresponding to capillary pressure (%), D is the fractal dimension of pores, P is the capillary pressure (MPa), Pmin is the capillary pressure corresponding to the maximum pore size (MPa), and K is the slope of the curve.
The calculation methods of solid fractal dimension by gas adsorption isotherm mainly include the fractal Brunauer–Emmett–Teller (BET) model method, Frenkel–Halsey–Hill (FHH) method, and thermodynamic method. Among them, the FHH method had been used many times in the calculation of fractal dimension of pore structure characteristics of porous materials due to its convenience and wide application range.41,43,44 Based on the liquid nitrogen adsorption data, the fractal dimensions of pores Da1 and Da2 were calculated by the FHH model,31 as shown in eqs 7 and 8
| 7 |
| 8 |
where V is the volume of adsorbed gas at equilibrium pressure P, P0 is the saturated vapor pressure (MPa), K is the fractal parameter, and C is the constant.
4. Results and Discussion
4.1. Basic Parameters of Coal Quality Characteristics
Ro,max of this test sample are between 0.60 and 0.73%, and vitrinite reflectance of vitrain and durain is equal. The vitrinite and inertinite contents of vitrain samples are 64.5–72.8 and 22.8–32.9%, respectively. Vitrinite and inertinite contents in durain samples range from 13.3–22.4 and 73.5–78.3% (Table 2), respectively. The vitrinite content in vitrain of each coal sample accounts for about two-third and inertinite content is less than one-third, while the content of two macerals in durain is opposite to vitrinite, and the inertinite content proportion is absolutely dominant. The content of liptinite in durain is greater than that in vitrain samples in the same coal seam, but the content of liptinite in both vitrain and durain is relatively low or even does not contain liptinite (Figure 4).
Table 2. Coal Quality Characteristics of Coal Samplesa.
| proximate analysis (%) |
maceral (%) |
|||||||||
|---|---|---|---|---|---|---|---|---|---|---|
| coal sample | sample type | Ro,max (%) | Mad (%) | Ad (%) | Vdaf (%) | FCad (%) | V (%) | I (%) | L (%) | M (%) |
| D01-JM | vitrain | 0.63 | 6.06 | 9.27 | 43.37 | 56.62 | 64.5 | 31.8 | 1.6 | 2.1 |
| D01-AM | durain | 4.32 | 14.06 | 31.49 | 68.51 | 18.2 | 73.5 | 2.6 | 5.7 | |
| H01-JM | vitrain | 0.73 | 3.41 | 14.18 | 37.88 | 54.03 | 72.8 | 22.8 | 1.1 | 3.3 |
| H01-AM | durain | 3.05 | 16.76 | 35.83 | 55.31 | 13.3 | 74.6 | 7.3 | 4.8 | |
| D02-JM | vitrain | 0.60 | 6.41 | 8.90 | 42.03 | 57.98 | 68.1 | 30.5 | 0.0 | 1.4 |
| D02-AM | durain | 5.58 | 5.75 | 29.07 | 70.93 | 19.0 | 78.3 | 0.9 | 1.8 | |
| D03-JM | vitrain | 0.63 | 6.33 | 9.38 | 42.97 | 57.03 | 64.9 | 32.9 | 0.8 | 1.4 |
| D03-AM | durain | 4.81 | 5.75 | 29.94 | 70.06 | 22.4 | 74.1 | 2.0 | 1.5 | |
Ro,max: maximum reflectance of vitrinite; V: vitrinite; I: inertinite; L: liptinite; M: mineral; Mad: moisture content on air-dried basis; Ad: ash yield on air-dried basis; Vdaf: volatile yield on dry ash-free basis; FCad: fixed carbon content on air-dried basis.
Figure 4.

Coal quality differences: (a) proximate analysis result and (b) maceral analysis result.
In addition, the mineral content in the coal is slightly higher in durain than vitrain, and it is mainly clay minerals. According to the results of the proximate analysis, the moisture content and volatile yield of vitrain are higher than those of durain, and the fixed carbon content of durain is higher than that of vitrain. All of the tested coal samples belong to low-ash or low-ash coal, and there is no obvious rule in the ash yield of vitrain and durain. The ash yield of H01-JM, H01-AM, and D01-AM samples is higher, which may be due to the high inorganic mineral content in these three samples. The permeability of durain is greater than that of vitrain, which may be due to the presence of high inertinite. The high proportion of large pore sizes in durain may be the main cause of this. As a result, different macroscopic coal compositions have significantly different coal quality and permeability.
4.2. Pore Distribution Characteristics
Mercury intrusion porosimetry (MIP) and liquid nitrogen adsorption (LNA) experiments were used to characterize the pore distribution characteristics of coal samples. In this paper, the pores in the test process were classified according to the Hodot classification method,45 namely, micropores (<10 nm), transition pores (10–100 nm), mesopores (100–1000 nm), and macropores (>1000 nm). Of these, micropores and transition pores have adsorption, and macropores and mesopores mainly have osmotic properties.28,29 Therefore, 100 nm is regarded as the boundary point between the adsorption pore and seepage pore, that is, the adsorption pore is <100 nm, while the seepage pore is >100 nm.
4.2.1. LNA Analysis
Experimental data from LNA can be used to judge the shape of pores in coal and to test the specific surface area and pore size distribution of pores in coal. As shown in Figure 4, the shapes of the LNA curve of coal are consistent, all indicating a sharp increase in P/P0 before 0.1. The adsorption capacity increases linearly for P/P0 greater than 0.1 for all but the HL coal sample, with the H01 coal sample increasing more and more rapidly, indicating a larger pore ratio for larger-pore-size profiles in the sample. It can be seen from the desorption curve in Figure 5 that the desorption curve of vitrain is relatively flat when P/P0 is large, and the desorption rate is slower or equivalent to that of durain, indicating that the pore ratio of durain in larger-pore-size section is larger than that of vitrain. This is because the inertinite content in durain is relatively large, and the plant cell cavity is better preserved. For the pores of the remaining plant tissues, they are mostly medium and large. At the same time, both vitrain and durain have a sudden drop-off point at a value of P/P0 around 0.5, but the hysteresis loop in vitrain is larger than that in durain, indicating that more ink bottle pores develop in vitrain.
Figure 5.

LNA curves of coal sample (a, b) H01, (c, d) D01, (e, f) D02, (g, h) D03.
4.2.2. MIP Analysis
The pore throat parameters and pore size distribution reflecting the pore structure of coal samples can be obtained by the mercury intrusion experiment, such as porosity, mercury saturation, drainage pressure, SSA, etc. (Table 3). In the same coal seam, it is found that the porosity of durain is greater than that of vitrain, and the median radius of durain is slightly larger than that of vitrain. The displacement pressure and the median pressure are normally used to characterize the pore connectivity. The smaller the displacement pressure, the better the pore connectivity, which favors fluid mobility and production in the pore. The durian displacement pressure and median pressure are smaller than the vitrain pressure, indicating that the pores of the durian are more favorable for methane storage and flow. Mercury pressure curves can characterize different pore structures and connectivity. As shown in Figure 6, the mercury intrusion and mercury extrusion curves for vitrain tend to be parallel for the first with decreasing pressure, and the volume difference between the curves changes slowly, indicating that the number of open pores in vitrain is limited. However, the volume difference between the mercury intrusion curve and the mercury extrusion curve of durain continues to vary, and the open pores are generally more developed. Overall, the seepage pore of durain is better than that of vitrain, and the pore structure in vitrain with high vitrinite content is mostly single-ended closed pores. The cell structures of the fusinite and semifusinite are well preserved in the inertinite, and the pores of the pyrofusinite are well developed. In general, well-preserved cells have good pore connectivity such that durain with high inertinite content develops open pores. Thus, vitrain is more favorable to gas adsorption and durain is more favorable to desorption.
Table 3. Pore Parameters of Mercury Intrusion Experiments.
| coal sample | porosity (%) | mercury intrusion saturation (%) | displacement pressure (MPa) | median pressure (MPa) | median radius (μm) | mercury withdrawal efficiency (%) |
|---|---|---|---|---|---|---|
| D01-JM | 8.28 | 58.84 | 0.53 | 14.72 | 0.05 | 38.25 |
| D01-AM | 9.21 | 69.86 | 0.16 | 4.52 | 0.16 | 40.62 |
| H01-JM | 4.72 | 70.81 | 0.20 | 10.14 | 0.07 | 31.74 |
| H01-AM | 2.92 | 75.00 | 0.07 | 6.27 | 0.12 | 25.46 |
| D02-JM | 11.35 | 77.26 | 2.02 | 24.28 | 0.03 | 34.61 |
| D02-AM | 11.81 | 68.95 | 0.31 | 5.48 | 0.13 | 44.43 |
| D03-JM | 9.16 | 69.84 | 1.03 | 8.16 | 0.09 | 41.85 |
| D03-AM | 10.29 | 68.96 | 0.06 | 3.35 | 0.22 | 31.52 |
Figure 6.

Mercury pressure curve: (a) D01, (b) H01, (c) D02, and (d) D03.
4.2.3. Combined Characterization of Full-Scale Pore Size Distribution
Based on the above studies, the results of the MIP and LNA experiments are jointly characterized. Because of the different principles used in the different methods of pore size analysis in coal, the range of the pore sizes tested is also different. When analyzed here, the pore size distribution of micropores and transition pores is analyzed by the LNA test, and the specific surface area, total pore volume, and pore size distribution of mesopores and macropores are analyzed by the MIP test (Table 4). The proportion of micropores and transition pores in the pores of vitrain is 22.23–75.63%, the proportion of mesopores and macropores is 24.37–77.77%, and the specific surface area is 4.26–9.62 m2 g–1. The proportion of micropores and transition pores in durain is 31.67–39.4%, the proportion of mesopores and macropores in the pore is 60.6–68.33%, and the specific surface area is 2.86–7.03 m2 g–1. The total pore volume of vitrain and durain is equivalent, and the total specific surface area is larger than that of durain, indicating that the micropores in vitrain are more developed and provide more specific surface area, while the mesopores and macropores in durain are more developed, showing a smaller specific surface area.
Table 4. Pore Structure Parametera.
| pore volume (10–3 m2 g–1) |
proportion of each pore section (%) |
||||
|---|---|---|---|---|---|
| coal sample | specific surface area (m2 g–1) | Vw + Vx | Vz + Vd | Vw + Vx | Vz + Vd |
| D01-JM | 4.26 | 19.75 | 20.52 | 49.04 | 50.96 |
| D01-AM | 4.63 | 18.69 | 33.20 | 36.00 | 63.98 |
| H01-JM | 5.28 | 4.8 | 16.79 | 22.23 | 77.77 |
| H01-AM | 2.86 | 6.24 | 12.56 | 33.19 | 66.81 |
| D02-JM | 9.62 | 25.04 | 8.07 | 75.63 | 24.37 |
| D02-AM | 7.03 | 27.35 | 42.07 | 39.40 | 60.6 |
| D03-JM | 7.17 | 19.65 | 27.25 | 41.90 | 58.1 |
| D03-AM | 4.35 | 17.35 | 37.43 | 31.67 | 68.33 |
Vw, micropores; Vx, transition pores; Vz, mesopores; Vd, macropores.
The influence of macro-coal components on the pore properties of coal reservoirs is mainly caused by the coal macerals and inorganic minerals.9,10 From vitrain to durain, the vitrinite content decreases, inertinite and mineral content increase, and exinite has minor effect on coal reservoir. The vitrinite has a significant contribution to the pore specific surface area and pore volume, while the inertinite contribution is weak. Different macerals have different original material compositions, different evolutionary processes under metamorphism, and different pores. Mineral filling may have an important impact on the development of coal pores. Some minerals fill certain pores through mineralization, which reduces the porosity of the coal reservoir.
4.3. Pore Fractal Characteristics
The fractal dimensions of the pores at different scales are quite different. Therefore, to analyze the heterogeneity of the coal pore characteristics, the fractal dimensions of seepage pores and adsorption pores were calculated from mercury intrusion and liquid nitrogen adsorption test data. The Washburn equation was used to calculate the fractal properties of the seepage pores in vitrain and durain. By drawing the scatter diagram of lg(1 – S) and lg P, the fractal parameters of seepage pore size are obtained (Figure 7). The curve slope K is obtained by data fitting, and the fractal dimension (Ds) of the seepage pore is calculated by eqs 5 and 6. P/P0 = 0.5 is taken as the dividing point and the fractal dimension of the coal pore is divided into two parts. The fractal dimension is Da1 when the relative pressure is less than 0.5 and Da2 when it is greater as shown in eqs 7 and 8. As shown in Figure 8, the fractal curve segmentation is clearer, indicating that the fractal features are quite different for each pore diameter segment, in agreement with previous analyses.10,12 Da1 represents the surface roughness of the pores. The larger the value of Da1, the rougher the microporous surface and the larger the methane adsorption capacity.9 Da2 is an indicator to measure the complexity of the pore structure, the higher this value and the more complex pore structure, the lower methane adsorption capacity.28,46
Figure 7.

Typical example of pore fractal dimension based on the mercury intrusion experimental data: (a) D01-JM and (b) D01-AM.
Figure 8.
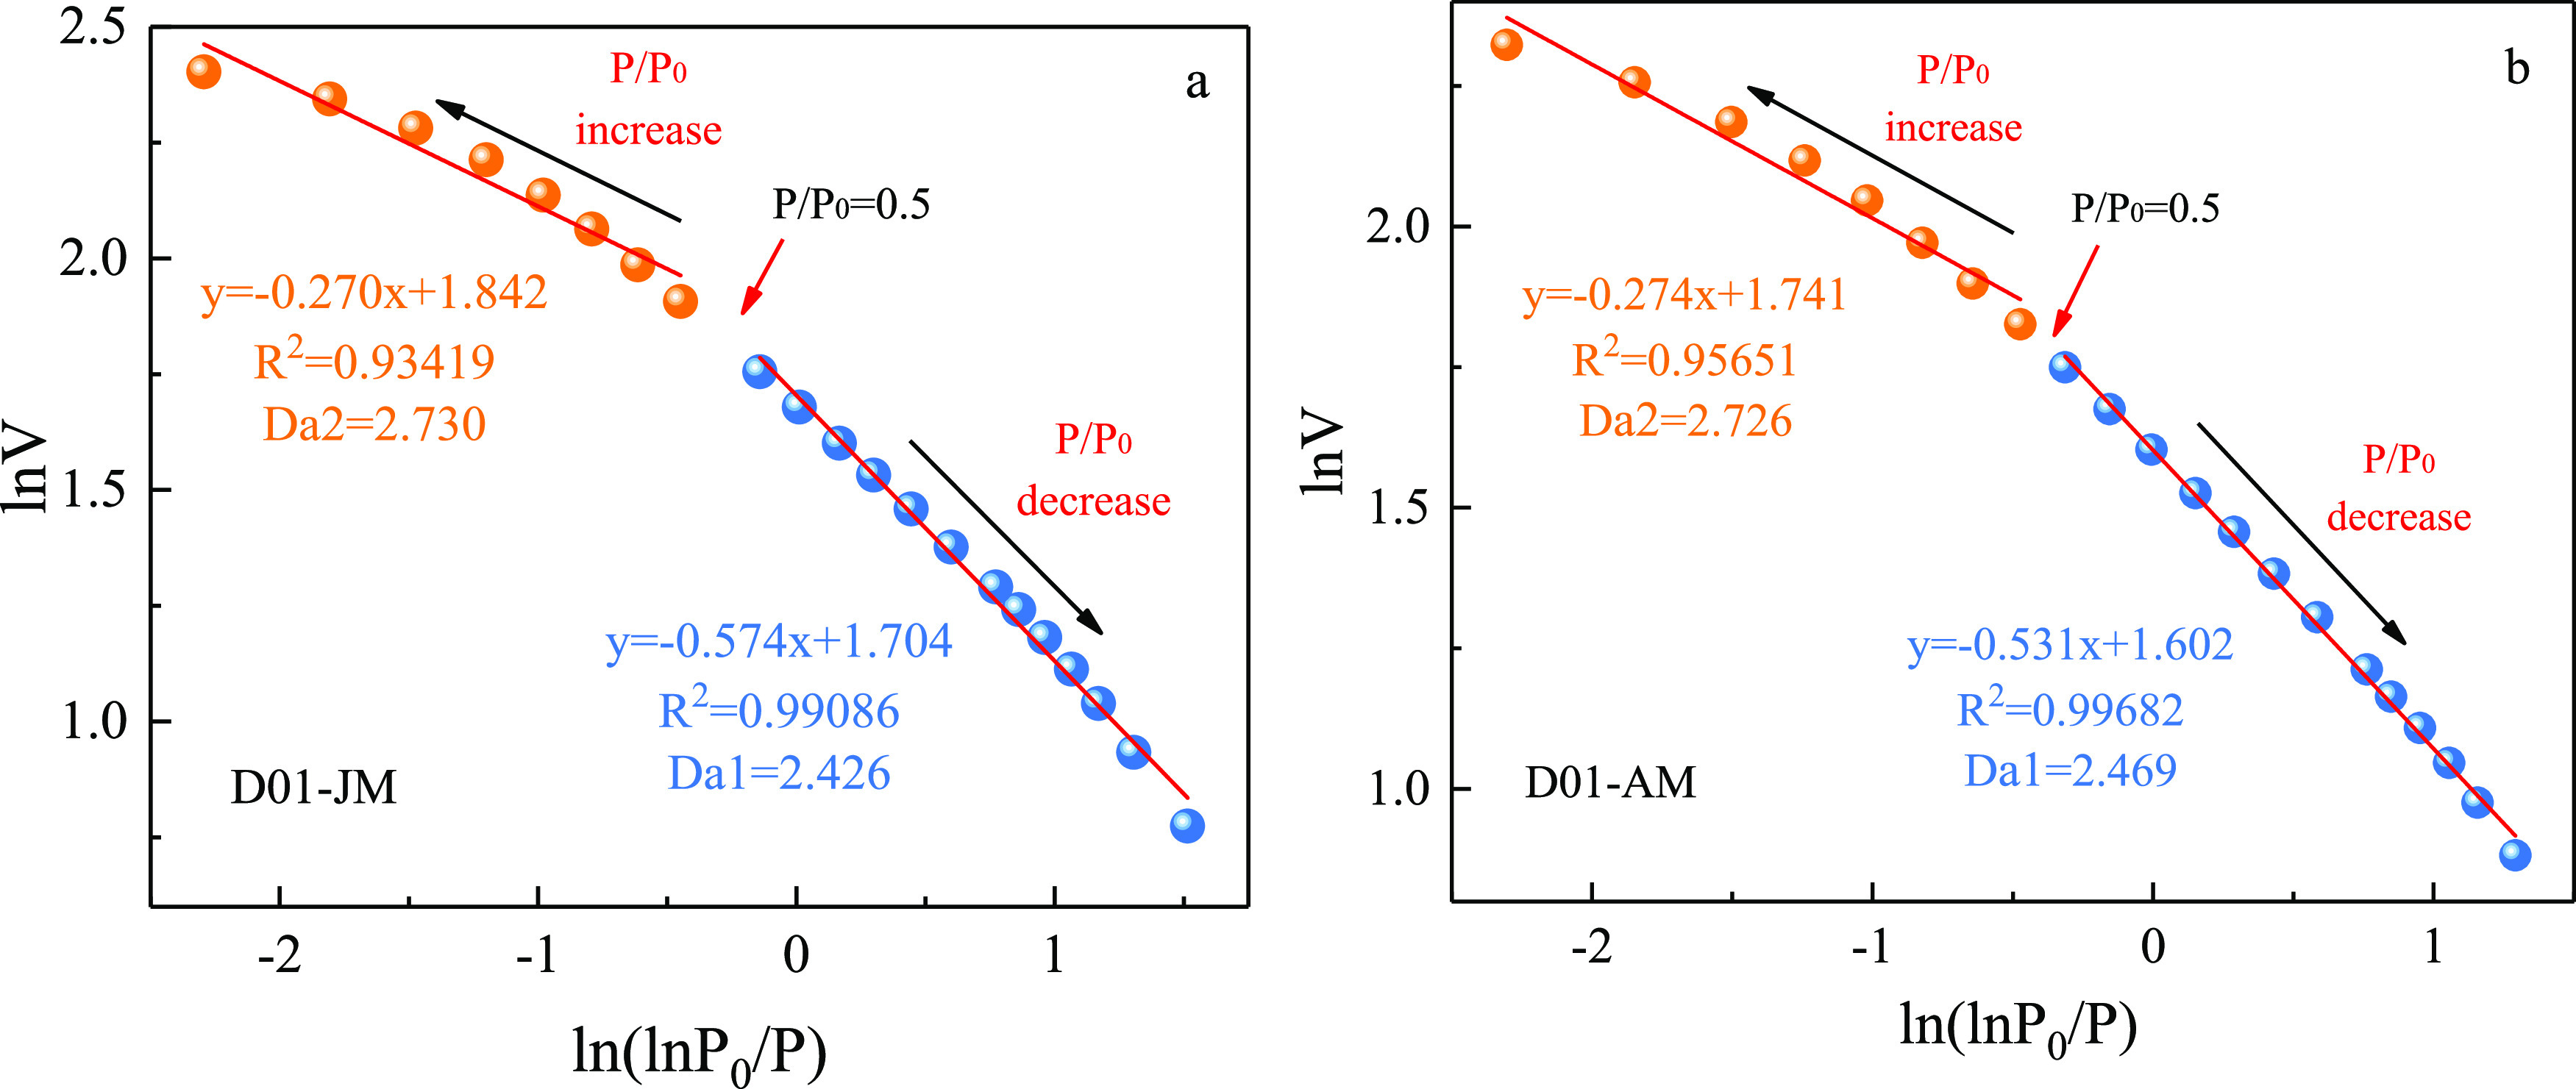
Typical example of pore fractal dimension based on the liquid nitrogen adsorption experiment data: (a) D01-JM and (b) D01-AM.
The fractal dimensions Da1, Da2, and Ds at different scales are 2.340–2.484, 2.650–2.818, and 2.765–2.970, respectively, with excellent correlation. The pore fractal dimension of coal samples with different macro-coal components is between 2 and 3, and the fractal characteristics are obvious (Table 5). At the same time, the fractal dimension Da1 is inferior than Da2, which leads to a decrease in methane adsorption capacity. Figure 9 shows Da1 < Da2 < Ds, indicating that the pore complexity increases with the increase of pore diameter.
Table 5. Pore Fractal Dimension and Permeability of Different Coal Samples.
| coal sample | Da1 | R2 | Da2 | R2 | Ds | R2 |
|---|---|---|---|---|---|---|
| D01-JM | 2.426 | 0.99086 | 2.730 | 0.93419 | 2.828 | 0.94060 |
| D01-AM | 2.469 | 0.99682 | 2.726 | 0.95651 | 2.795 | 0.99043 |
| H01-JM | 2.340 | 0.99953 | 2.663 | 0.92431 | 2.831 | 0.99721 |
| H01-AM | 2.365 | 0.99927 | 2.650 | 0.96129 | 2.857 | 0.91805 |
| D02-JM | 2.432 | 0.99408 | 2.788 | 0.91410 | 2.970 | 0.94345 |
| D02-AM | 2.484 | 0.99591 | 2.765 | 0.93259 | 2.765 | 0.97509 |
| D03-JM | 2.442 | 0.99365 | 2.762 | 0.94079 | 2.770 | 0.92528 |
| D03-AM | 2.376 | 0.98446 | 2.818 | 0.91032 | 2.857 | 0.99881 |
Figure 9.

Comparison of pore fractal dimension.
4.3.1. Fractal Characteristics of Adsorption Pore
The degree of coalification, the vitrinite content, the mineral content, the ash yield, and other factors have certain effects on the coal pore structure.10 According to the above, the vitrinite content of vitrain is significantly higher than that of durain, and there is no apparent regularity in the ash yield, but high mineral content is accompanied by high ash yield. It is evident in Figure 10 that the adsorption pore Da2 of vitrain increases first and then decreases with vitrinite content. Because the vitrinite develops more ink bottle pores and a closed parallel plate pore.47 The existence of this type of pore can increase the fractal dimension Da2, but with the increase of vitrinite content, the type of pore is gradually single, and the Da2 of the adsorption pore decreases. The higher vitrinite content of durain, the greater the Da2, due to the fact that the pores in vitrinite and structural vitrinite are more developed in the original plant cell pores, making the pores more complex and leading to a larger Da2. The fractal dimension Da2 of vitrain and durain decreased with the increase of mineral content, which may be due to the increased mineral content playing a role in filling the pore, resulting in the decrease of the complexity of the pore structure.
Figure 10.

Relationship between the fractal dimension of adsorption pore: (a) vitrinite content-Da2, (b) mineral content-Da2, (c) specific surface area-Da1, (d) specific surface area-Da2, (e) pore volume-Da1, and (f) pore volume-Da2.
During coal formation, the physical compaction causes the medium and large pores of coal to become micropores, resulting in a simpler pore structure; hence, the fractal dimension Da2 is significantly smaller for H01-JM. According to Figure 10, the fractal dimensions Da1 and Da2 tend to increase when the specific surface area and pore volume increase, indicating that the pore structure is more complex for larger specific surface area and pore volume.
4.3.2. Fractal Characteristics of Seepage Pore
The seepage pore mainly affects the transport of coalbed methane, and excellent seepage capacity helps in the successful exploitation of coalbed methane. The fractal dimension of coal seepage pores has been studied using MIP data. As shown in Figure 11, the relation between the vitrinite content and the fractal dimension Ds shows a polynomial distribution. In the vitrain samples, Ds first increases and then decreases with the vitrinite content, which is similar to the previous Da2 relation, while the opposite is true for durain. The vitrain content is negatively correlated with the fractal dimension Ds. The higher the mineral content, the pore may be blocked, the complexity of the pore is reduced, and the Ds is reduced. The relation between the fractal dimension Ds of durain and the mineral content is not obvious.
Figure 11.

Relationship between fractal dimension of seepage pore: (a) vitrinite content-Ds, (b) mineral content-Ds, (c) proportion of seepage pore-Ds, and (d) median pressure-Ds.
The pore structure heterogeneity of coal can be reflected by the fractal dimension, but the higher fractal dimension does not necessarily imply higher seepage capacity.12 In addition, Figure 11 shows that the fractal dimension Ds of vitrain is positively correlated with the median pressure. The relation between the median pressure of durain and Ds first increases and then decreases. The effect of the proportion of seepage pores on Ds is clear and the correlation is strong. As the pores of durain are mainly medium and large, the connectivity between the coal seam is favorable and the pore structure is relatively simple.
4.4. Fractal Dimension and Adsorption/Desorption Characteristics
According to eqs 1 and 2, the adsorption/desorption parameters of all test samples at 25 °C were obtained by fitting, and the desorption parameters and desorption efficiency of coal samples were calculated by fitting eqs 3 and 4 (Table 6). According to the relationship between each parameter and fractal dimension (Figure 12), it can be obviously seen that the saturated adsorption amount of vitrain was positively correlated with the fractal dimension Da1, and the fitting degree reached 0.99674. However, the saturated adsorption amount of the durain samples is binomial with Da1, first increasing and then decreasing. The adsorption capacity of both is positively correlated with Da2, which is due to the lower development of small pore size pores in durain and the much larger development of large pore sizes in durain than in vitrain. Micropores are more favorable for methane adsorption, leading to an increase first and then a decrease in the adsorption capacity of durain. The fractal dimension and the photoluminescence (PL) of vitrain and durain show the same law of change, that is, when the fractal dimension increases, the PL has an upward trend, indicating that the more complex the pore structure of the adsorption pore, the more favorable for gas adsorption. On the one hand, as the coal adsorbs methane, it causes the coal matrix to expand, and the expansion further narrows the pore channels of these pores. On the other hand, the complex surface corresponds to a more dynamic system, which leads to an increase in the number of available adsorption points and adsorption potential.48−50 The desorption efficiency is generally measured in terms of the theoretical desorption rate and the recovery factor. The theoretical desorption rate and recovery factor of durain are negatively correlated with the fractal dimension Ds, indicating that the more rougher and more complex the pore surface, the lower the desorption efficiency. The theoretical desorption rate and recovery factor of vitrain show a binomial distribution with the increase of Ds, which may be because the mercury intrusion experiment has certain damage to smaller pores, resulting in deviation of pore measurement. Overall, the fractal dimension is negatively correlated with desorption efficiency, that is, the more complex the pore structure, the more unfavorable the exploitation of coalbed methane.
Table 6. Parameters of Methane Adsorption/Desorption and Desorption Efficiency.
| adsorption |
desorption |
||||||
|---|---|---|---|---|---|---|---|
| coal sample | VL (cm3 g–1) | PL (MPa) | VL (cm3 g–1) | PL (MPa) | c(cm3 g–1) | theoretical desorption rate (%) | recovery factor (%) |
| D01-JM | 18.10 | 3.73 | 4.59 | 4.36 | 4.36 | 75.91 | 66.62 |
| D01-AM | 16.85 | 4.30 | 4.49 | 3.24 | 3.24 | 78.34 | 69.32 |
| HL-JM | 9.31 | 2.81 | 7.00 | 4.95 | 2.67 | 71.34 | 62.03 |
| HL-AM | 8.12 | 4.06 | 6.31 | 6.53 | 2.01 | 75.28 | 67.75 |
| D02-JM | 18.67 | 3.22 | 14.40 | 4.52 | 4.22 | 77.41 | 67.07 |
| D02-AM | 15.68 | 4.74 | 12.48 | 6.73 | 3.14 | 79.96 | 72.46 |
| D03-JM | 19.55 | 3.71 | 15.52 | 5.47 | 4.24 | 78.34 | 69.32 |
| D03-AM | 17.55 | 4.34 | 14.71 | 6.22 | 3.17 | 81.97 | 73.50 |
Figure 12.

Relationship between pore fractal dimension and adsorption/desorption: (a) Da1-VL, (b) Da2-VL, (c) Da1-PL, (d) Da2-PL, (e) Ds-theoretical desorption rate, and (f) Ds-recovery factor.
In the desorption process, the desorption efficiency is higher in durain than in vitrain because the contents of the ink bottle pore in durain are inferior to those in vitrain. The pore size of vitrain is small, and the contents of ink bottle pores are larger. After adsorption and expansion of the coal matrix, the connected pore channels become narrower or even closed. Finally, when the pressure is reduced and desorbed, there are fewer methane molecules that can be desorbed through the narrow pore channels. Overall, the adsorption capacity of vitrain is better than that of durain, and durain is easier to desorb. The theoretical desorption rate and recovery factor of durain are higher than those of vitrain.
5. Conclusions
In this paper, based on LNA and MIP experiments, we studied the pores fractal characteristics of different macro-coal components and analyzed the relationship between multifractal parameters and adsorption/desorption characteristics. The main results are as follows.
-
(1)
The pore characteristics of different macro-coal components are obviously different. In the same coal seam, the microscopic pores of vitrain are more developed than durain, and the specific surface area is greater. The seepage pores of durain are better than vitrain.
-
(2)
According to fractal theory, the pore complexity increases with the increase of pore size. The fractal dimension of coal samples with macro-coal components is between 2 and 3, and the fractal dimension Da1 is smaller than Da2.
-
(3)
The fractal dimensions Da2 and Ds of vitrain increase first and then decrease with the content of vitrinite, and the Da2 of durain is negatively correlated with the content of vitrinite. The mineral content, specific surface area, and pore volume contribute to the roughness of the pore surface. The fractal dimension Ds of vitrain is positively correlated with the median pressure.
-
(4)
The saturated adsorption capacity of vitrain increases with the increase of fractal dimension Da1, while the fitting curve between the saturated adsorption capacity of durain samples and Da1 increases first and then decreases. When the pore structure is complex, it is not conducive to the exploitation of coalbed methane.
Acknowledgments
This work was supported by the National Natural Science Foundation of China (Grant Nos. 41902175 and 41972183), the Shanxi Province Science and Technology Major Special Funding Project (Grant No. 20201101002), the Shaanxi Province Natural Science Basic Research Program Funding Project (Grant No. 2019JQ-245), the Open Project Funding Project of the Key Laboratory of Coal Resources Exploration and Comprehensive Utilization of the Ministry of Natural Resources (Grant No. KF2019-2), and the projects funded by the China Postdoctoral Science Foundation (Grant No. 2019M653873XB). The authors also thank the editor and anonymous reviewers very much for the valuable comments and suggestions that have greatly improved the manuscript.
The authors declare no competing financial interest.
References
- Moore T. A. Coalbed methane: A review. Int. J. Coal Geol. 2012, 101, 36–81. 10.1016/j.coal.2012.05.011. [DOI] [Google Scholar]
- Qin Y.; Moore T. A.; Shen J.; Yang Z.; Shen Y.; Wang G. Resources and geology of coalbed methane in China: a review. Int. Geol. Rev. 2018, 60, 777–812. 10.1080/00206814.2017.1408034. [DOI] [Google Scholar]
- Lau H. C.; Li H.; Huang S. Challenges and Opportunities of Coalbed Methane Development in China. Energy Fuels 2017, 31, 4588–4602. 10.1021/acs.energyfuels.7b00656. [DOI] [Google Scholar]
- Cai Y.; Liu D.; Yao Y.; Li J.; Liu J. Fractal Characteristics of Coal Pores Based on Classic Geometry and Thermodynamics Models. Acta Geol. Sin. (Engl. Ed.) 2011, 85, 1150–1162. 10.1111/j.1755-6724.2011.00547.x. [DOI] [Google Scholar]
- Yu S.; Bo J.; Jie-gang L. Nanopore Structural Characteristics and Their Impact on Methane Adsorption and Diffusion in Low to Medium Tectonically Deformed Coals: Case Study in the Huaibei Coal Field. Energy Fuels 2017, 31, 6711–6723. 10.1021/acs.energyfuels.7b00512. [DOI] [Google Scholar]
- Cheng M.; Fu X.; Kang J. Compressibility of Different Pore and Fracture Structures and Its Relationship with Heterogeneity and Minerals in Low-Rank Coal Reservoirs: An Experimental Study Based on Nuclear Magnetic Resonance and Micro-CT. Energy Fuels 2020, 34, 10894–10903. 10.1021/acs.energyfuels.0c02119. [DOI] [Google Scholar]
- Ma Y.; Wang M.; Zhao X.; Dai X.; He Y. Study of the Microstructural Characteristics of Low-Rank Coal under Different Degassing Pressures. Energies 2022, 15, 3691 10.3390/en15103691. [DOI] [Google Scholar]
- Li Y.; Tang D.; Elsworth D.; Xu H. Characterization of Coalbed Methane Reservoirs at Multiple Length Scales: A Cross-Section from Southeastern Ordos Basin, China. Energy Fuels 2014, 28, 5587–5595. 10.1021/ef500449s. [DOI] [Google Scholar]
- Zhao J.; Xu H.; Tang D.; Mathews J. P.; Li S.; Tao S. Coal seam porosity and fracture heterogeneity of macrolithotypes in the Hancheng Block, eastern margin, Ordos Basin, China. Int. J. Coal Geol. 2016, 159, 18–29. 10.1016/j.coal.2016.03.019. [DOI] [Google Scholar]
- Fu H.; Tang D.; Xu T.; Xu H.; Tao S.; Li S.; Yin Z.; Chen B.; Zhang C.; Wang L. Characteristics of pore structure and fractal dimension of low-rank coal: A case study of Lower Jurassic Xishanyao coal in the southern Junggar Basin, NW China. Fuel 2017, 193, 254–264. 10.1016/j.fuel.2016.11.069. [DOI] [Google Scholar]
- Tao S.; Chen S.; Tang D.; Zhao X.; Xu H.; Li S. Material composition, pore structure and adsorption capacity of low-rank coals around the first coalification jump: A case of eastern Junggar Basin, China. Fuel 2018, 211, 804–815. 10.1016/j.fuel.2017.09.087. [DOI] [Google Scholar]
- Zhao J.; Tang D.; Qin Y.; Xu H. Fractal characterization of pore structure for coal macrolithotypes in the Hancheng area, southeastern Ordos Basin, China. J. Pet. Sci. Eng. 2019, 178, 666–677. 10.1016/j.petrol.2019.02.060. [DOI] [Google Scholar]
- Chen Y.; Fu H.; Ma D.; Duan Z.; Zhang Y.; Yang F.; Li W.; Zheng C.; Teng J. Differences of the Pore Structure and Methane Adsorption/Desorption between Vitrain and Durain of Low-Rank Coals: Case Study in the Huanglong Coalfield, Southern Ordos Basin, China. J. Energy Eng. 2021, 147, 04021038 10.1061/(ASCE)EY.1943-7897.0000784. [DOI] [Google Scholar]
- Jiang P.; Xu H.; Wu H.; Xin F.; Zhao T.; Chen X. Pore characteristics and its heterogeneity of lignite reservoir in the Erlian Basin of Inner Mongolia, China. Energy Explor. Exploit. 2022, 40, 1555–1572. 10.1177/01445987221099088. [DOI] [Google Scholar]
- Liu X.; Nie B. Fractal characteristics of coal samples utilizing image analysis and gas adsorption. Fuel 2016, 182, 314–322. 10.1016/j.fuel.2016.05.110. [DOI] [Google Scholar]
- Zhou S.; Liu D.; Cai Y.; Yao Y. Fractal characterization of pore–fracture in low-rank coals using a low-field NMR relaxation method. Fuel 2016, 181, 218–226. 10.1016/j.fuel.2016.04.119. [DOI] [Google Scholar]
- Peng C.; Zou C.; Yang Y.; Zhang G.; Wang W. Fractal analysis of high rank coal from southeast Qinshui basin by using gas adsorption and mercury porosimetry. J. Pet. Sci. Eng. 2017, 156, 235–249. 10.1016/j.petrol.2017.06.001. [DOI] [Google Scholar]
- Zhou S.; Liu D.; Cai Y.; Yao Y. Effects of the coalification jump on the petrophysical properties of lignite, subbituminous and high-volatile bituminous coals. Fuel 2017, 199, 219–228. 10.1016/j.fuel.2017.02.092. [DOI] [Google Scholar]
- Hazra B.; Wood D. A.; Vishal V.; Varma A. K.; Sakha D.; Singh A. K. Porosity controls and fractal disposition of organic-rich Permian shales using low-pressure adsorption techniques. Fuel 2018, 220, 837–848. 10.1016/j.fuel.2018.02.023. [DOI] [Google Scholar]
- Shi X.; Pan J.; Hou Q.; Jin Y.; Wang Z.; Niu Q.; Li M. Micrometer-scale fractures in coal related to coal rank based on micro-CT scanning and fractal theory. Fuel 2018, 212, 162–172. 10.1016/j.fuel.2017.09.115. [DOI] [Google Scholar]
- Zhou H. W.; Zhong J. C.; Ren W. G.; Wang X. Y.; Yi H. Y. Characterization of pore-fracture networks and their evolution at various measurement scales in coal samples using X-ray μCT and a fractal method. Int. J. Coal Geol. 2018, 189, 35–49. 10.1016/j.coal.2018.02.007. [DOI] [Google Scholar]
- Zheng S.; Yao Y.; Liu D.; Cai Y.; Liu Y.; Li X. Nuclear magnetic resonance T2 cutoffs of coals: A novel method by multifractal analysis theory. Fuel 2019, 241, 715–724. 10.1016/j.fuel.2018.12.044. [DOI] [Google Scholar]
- Chen H.; Tian W.; Chen Z.; Zhang Q.; Tao S. Genesis of Coalbed Methane and Its Storage and Seepage Space in Baode Block, Eastern Ordos Basin. Energies 2022, 15, 81 10.3390/en15010081. [DOI] [Google Scholar]
- Wang X.; Dang Z.; Hou S.; Yuan Y.; Wang X.; Pan S. Fractal characteristics of pulverized high volatile bituminous coals with different particle size using gas adsorption. Fuel 2022, 315, 122814 10.1016/j.fuel.2021.122814. [DOI] [Google Scholar]
- Zhou S.; Wang H.; Jiang S.; Yan D.; Liu D.; Zhang Z.; Li G. A Novel Approach to Obtain Fractal Dimension in Coals by LFNMR: Insights from the T2 Peak and T2 Geometric Mean. J. Energy Eng. 2022, 148, 04022009 10.1061/(ASCE)EY.1943-7897.0000827. [DOI] [Google Scholar]
- Liu S.; Li X.; Wang D.; Zhang D. Investigations on the mechanism of the microstructural evolution of different coal ranks under liquid nitrogen cold soaking. Energy Sources, Part A 2020, 1–17. 10.1080/15567036.2020.1841856. [DOI] [Google Scholar]
- Shi Q.; Cui S.; Wang S.; Mi Y.; Sun Q.; Wang S.; Shi C.; Yu J. Experiment study on CO2 adsorption performance of thermal treated coal: Inspiration for CO2 storage after underground coal thermal treatment. Energy 2022, 254, 124392 10.1016/j.energy.2022.124392. [DOI] [Google Scholar]
- Yao Y.; Liu D.; Tang D.; Tang S.; Huang W. Fractal characterization of adsorption-pores of coals from North China: An investigation on CH4 adsorption capacity of coals. Int. J. Coal Geol. 2008, 73, 27–42. 10.1016/j.coal.2007.07.003. [DOI] [Google Scholar]
- Yao Y.; Liu D.; Tang D.; Tang S.; Huang W.; Liu Z.; Che Y. Fractal characterization of seepage-pores of coals from China: An investigation on permeability of coals. Comput. Geosci. 2009, 35, 1159–1166. 10.1016/j.cageo.2008.09.005. [DOI] [Google Scholar]
- Cai Y.; Liu D.; Pan Z.; Yao Y.; Li J.; Qiu Y. Pore structure and its impact on CH4 adsorption capacity and flow capability of bituminous and subbituminous coals from Northeast China. Fuel 2013, 103, 258–268. 10.1016/j.fuel.2012.06.055. [DOI] [Google Scholar]
- Zhang S.; Tang S.; Tang D.; Huang W.; Pan Z. Determining fractal dimensions of coal pores by FHH model: Problems and effects. J. Nat. Gas Sci. Eng. 2014, 21, 929–939. 10.1016/j.jngse.2014.10.018. [DOI] [Google Scholar]
- Zhou S.; Liu D.; Cai Y.; Yao Y. Gas sorption and flow capabilities of lignite, subbituminous and high-volatile bituminous coals in the Southern Junggar Basin, NW China. J. Nat. Gas Sci. Eng. 2016, 34, 6–21. 10.1016/j.jngse.2016.06.039. [DOI] [Google Scholar]
- Sun W.; Feng Y.; Jiang C.; Chu W. Fractal characterization and methane adsorption features of coal particles taken from shallow and deep coalmine layers. Fuel 2015, 155, 7–13. 10.1016/j.fuel.2015.03.083. [DOI] [Google Scholar]
- Shan C.; Zhang T.; Liang X.; Zhang Z.; Wang M.; Zhang K.; Zhu H. On the fundamental difference of adsorption-pores systems between vitrinite- and inertinite-rich anthracite derived from the southern Sichuan basin, China. J. Nat. Gas Sci. Eng. 2018, 53, 32–44. 10.1016/j.jngse.2018.02.025. [DOI] [Google Scholar]
- Wang G.; Shen J.; Liu S.; Jiang C.; Qin X. Three-dimensional modeling and analysis of macro-pore structure of coal using combined X-ray CT imaging and fractal theory. Int. J. Rock Mech. Min. Sci. 2019, 123, 104082 10.1016/j.ijrmms.2019.104082. [DOI] [Google Scholar]
- Luo Y.; Xia B.; Li H.; Hu H.; Wu M.; Ji K. Fractal permeability model for dual-porosity media embedded with natural tortuous fractures. Fuel 2021, 295, 120610 10.1016/j.fuel.2021.120610. [DOI] [Google Scholar]
- GB/T212-2008, Proximate analysis method of coal. National Standard of the People’s Republic of China. (in Chinese), 2008.
- GB/T15590-2008, Method for determination of microscopic coal rock type. Standardization Administration of China. (in Chinese), 2008.
- Busch A.; Gensterblum Y.; Krooss B. M. Methane and CO2 sorption and desorption measurements on dry Argonne premium coals: pure components and mixtures. Int. J. Coal Geol. 2003, 55, 205–224. 10.1016/S0166-5162(03)00113-7. [DOI] [Google Scholar]
- Dongmin M.; Wei M.; Yabing L. Desorption hys-teresis characteristics of CBM. J. China Coal Soc. 2012, 37, 1885–1889. [Google Scholar]
- Zhou S.; Liu D.; Cai Y.; Karpyn Z.; Yao Y. Comparative analysis of nanopore structure and its effect on methane adsorption capacity of Southern Junggar coalfield coals by gas adsorption and FIB-SEM tomography. Microporous Mesoporous Mater. 2018, 272, 117–128. 10.1016/j.micromeso.2018.06.027. [DOI] [Google Scholar]
- Qin L.; Wang P.; Zhai C.; Shugang L.; Haifei L.; Hang L. Research on Fractal Characteristics of Coal Freezing with Low Temperature Liquid Nitrogen Based on Nitrogen Adsorption Method and Mercury Intrusion Method. J. Min. Safe Eng. 2022, 1–12. [Google Scholar]
- Qin L.; Li S.; Zhai C.; Lin H.; Zhao P.; Shi Y.; Bai Y. Changes in the pore structure of lignite after repeated cycles of liquid nitrogen freezing as determined by nitrogen adsorption and mercury intrusion. Fuel 2020, 267, 117214 10.1016/j.fuel.2020.117214. [DOI] [Google Scholar]
- Liu X.; Kong X.; Nie B.; Song D.; He X.; Wang L. Pore Fractal Dimensions of Bituminous Coal Reservoirs in North China and Their Impact on Gas Adsorption Capacity. Nat. Resour. Res. 2021, 30, 4585–4596. 10.1007/s11053-021-09958-7. [DOI] [Google Scholar]
- Hodot B. B.Outburst of Coal and Coalbed Gas; China Industry Press: Beijing, 1966. [Google Scholar]
- Lin Y.; Qin Y.; Qiao J.; Li G.; Zhang H. Effect of coalification and maceration on pore differential development characteristics of high-volatile bituminous coal. Fuel 2022, 318, 123634 10.1016/j.fuel.2022.123634. [DOI] [Google Scholar]
- Zan H.; Bin S.; Qing Y.; Shimin M.; Yanwen S.; Wenguang T.; Lin Q.; Lei H. Study on characterization and fractal features of adsorption pores of coal reservoirs in Jixi Basin. Coal Sci. Technol. 2021, 49, 218–226. [Google Scholar]
- Tao S.; Pan Z.; Chen S.; Tang S. Coal seam porosity and fracture heterogeneity of marcolithotypes in the Fanzhuang Block, southern Qinshui Basin, China. J. Nat. Gas Sci. Eng. 2019, 66, 148–158. 10.1016/j.jngse.2019.03.030. [DOI] [Google Scholar]
- Yang L.; Xu C.; Wan F.; He H.; Gu H.; Xiong J. Synthesis of RGO/BiOI/ZnO composites with efficient photocatalytic reduction of aqueous Cr(VI) under visible-light irradiation. Mater. Res. Bull. 2019, 112, 154–158. 10.1016/j.materresbull.2018.12.019. [DOI] [Google Scholar]
- Li C.; Yang Z.; Chen J.; Sun H. Prediction of Critical Desorption Pressure of Coalbed Methane in Multi-coal Seams Reservoir of Medium and High Coal Rank: A Case Study of Eastern Yunnan and Western Guizhou, China. Nat. Resour. Res. 2022, 31, 1443–1461. 10.1007/s11053-022-10034-x. [DOI] [Google Scholar]