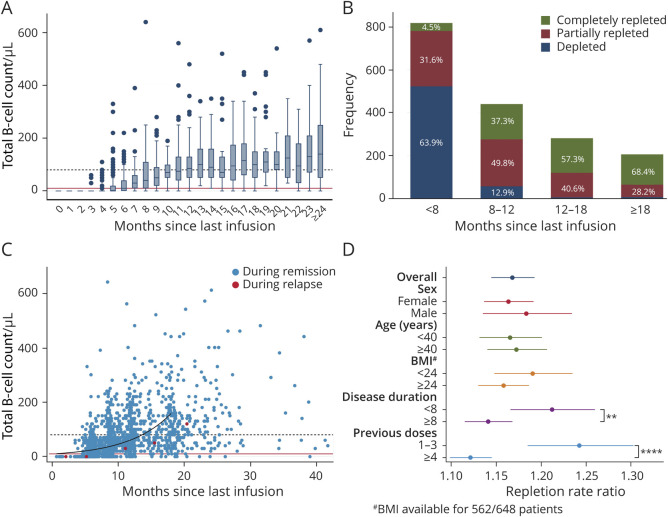
Figure 3. Total B-Cell Repopulation Dynamics in Relation to Time Since Last Rituximab Infusion.
(A) Box plot depicting distributions of B-cell count grouping samples into 1-month-time intervals since last rituximab infusion. Continuous red line: B-cell detection limit; dashed black line: LLN. (B) Total number of observations (y axis) with relative frequencies (bar labels) of depleted (<10 cells/μL), partially repleted (≥10–80 cells/μL), and completely repleted (≥80 cells/μL) B-cell counts at <8 months, ≥8 to 12, ≥12 to 18, and ≥18 months since last rituximab infusion. (C) Scatter plot of total B-cell counts in relation to time since last infusion, with samples collected within 1 month from a relapse/contrast-enhancing lesion highlighted in red. The predicted repopulation kinetic up to 18 months since last rituximab infusion according to a negative binomial regression model is depicted by the black curve. Continuous red line: B-cell detection limit; dashed black line: lower limit of normal. (D) Coefficient plot of the repletion rate ratios (RRs) for B-cell repopulation for the overall model and stratified according to sex, age (<40 and ≥40 years of age), BMI (<24 and ≥24 kg/m2), disease duration (<8 and ≥8 years), and number of previous rituximab doses (1–3 and ≥4). Among the analyzed potential effect modifiers, disease duration and number of previous rituximab doses affected B-cell reappearance kinetics (Wald test p < 0.01 for disease duration, **, and p < 0.0001 for rituximab doses, ****). #BMI data were available for 86.7% of the patients, 86.5% of the samples.

