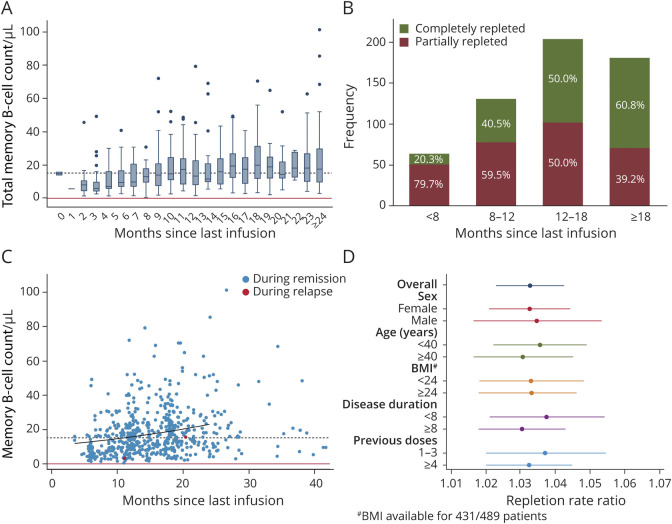
Figure 4. Memory B-Cell Repopulation Dynamics in Relation to Time Since Last Rituximab Infusion.
(A) Box plot showing distributions of memory B-cell count grouping samples into 1-month time intervals since last rituximab infusion. Continuous red line: memory B-cell detection limit; dashed black line: lower limit of normal. (B) Total number of observations (y axis) with relative frequencies (bar labels) of depleted (<0.05 cells/μL), partially repleted (≥0.05–15.2 cells/μL), and completely repleted (≥15.2 cells/μL) levels of memory B cells at <8 months, ≥8 to 12, ≥12 to 18, and ≥18 months since last rituximab infusion. (C) Scatter plot of memory B-cell counts in relation to time since last infusion, with samples collected within 1 month from a relapse/contrast-enhancing lesion highlighted in red. The repopulation kinetic predicted by a negative binomial regression model up to 24 months since last rituximab infusion is shown by the black curve. Continuous red line: memory B-cell detection limit; dashed black line: lower limit of normal. (D) Coefficient plot of the repletion rate ratios (RRs) for memory B-cell repopulation for the overall model and stratified according to sex, age, BMI, disease duration, and number of previous rituximab doses. None of the models showed any effect of the analyzed covariates on memory B-cell repletion rates. #BMI data were available for 88.1% of the patients, 86.9% of the samples. BMI = body mass index

