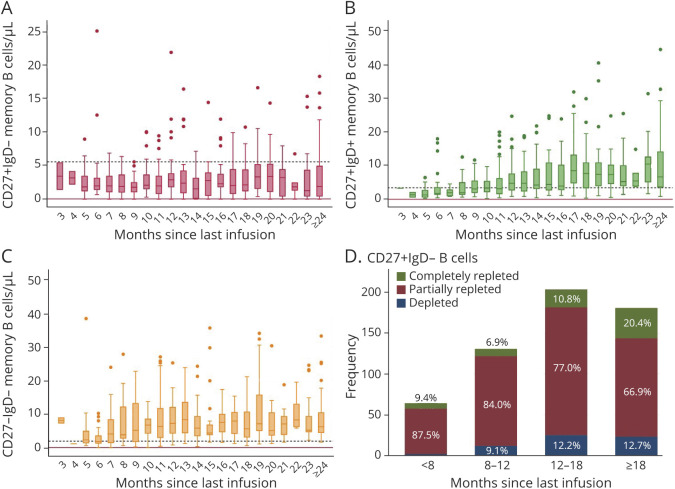
Figure 5. Memory B Subpopulation Repopulation Dynamics.
(A–C) Box plot showing distributions of the 3 subsets of memory B cell: CD27+IgD− (A), CD27+IgD+ or double positive (DP, B), and CD27−IgD− or double negative (DN, C). Samples were grouped into 1-month time intervals since last rituximab infusion. Continuous red line: memory B-cell detection limit (0.05 cells/μL for all subsets); dashed black line: lower limit of normal (5.6 cells/μL for CD27+IgD− cells, 3.44 cells/μL for DP cells and 1.92 cells/μL for DN cells). (D) Total number of observations (y axis) with relative frequencies (bar labels) of depleted (<0.05 cells/μL), partially repleted (≥0.05–5.6 cells/μL), and completely repleted (≥5.6 cells/μL) levels of CD27+IgD− memory B cells at <8 months, ≥8 to 12, ≥12 to 18, and ≥18 months since last rituximab infusion.

