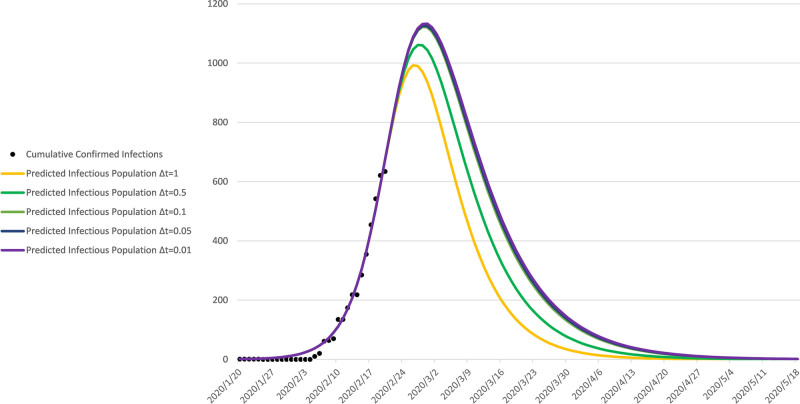
Fig. 5.
Nonlinear least-squared curve fitting method. The cumulative confirmed infections (observations: black dot) and predicted infectious population (by SIR model choosing different step sizes: ∆t = 1, 0.5, 0.1, 0.05, 0.01 day respectively) of the Diamond Princess cruise ship are shown together for comparison.

