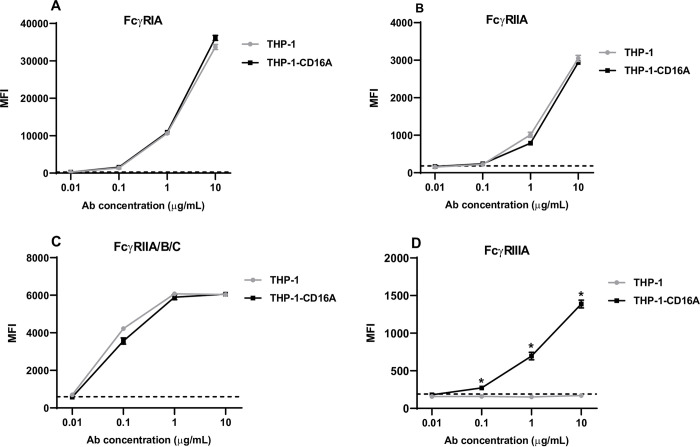
Fig 2. Expression of human FcγRs on THP-1 and THP-1-CD16A cells.
Five hundred thousand cells were stained with direct-labelled monoclonal antibodies against (A) FcγRI (clone 10.1 conjugated to PE/Cy7), (B) FcγRIIA (clone IV.3 conjugated to FITC), (C) FcγRIIA/B/C (clone AT10 conjugated to AF647), and (D) FcγRIIIA (clone 3G8 conjugated to BV421). Stained cells were washed and analyzed by flow cytometry using a BD LSRFortessa X-20. Data analysis was performed using FlowJo v10. Data are presented as the mean ± the standard deviation from four independent experiments. MFI: Mean fluorescent intensity (arbitrary units). Antibody concentration: Concentration of the fluorescent antibody for FcγR expression detection. The dashed line represents the MFI value for the corresponding isotype control at 10 μg/mL. The statistical analysis was performed using the non-parametric Mann-Whitney T-test, comparing the MFI of both cell lines for each antibody concentration (*: p = 0.05).

