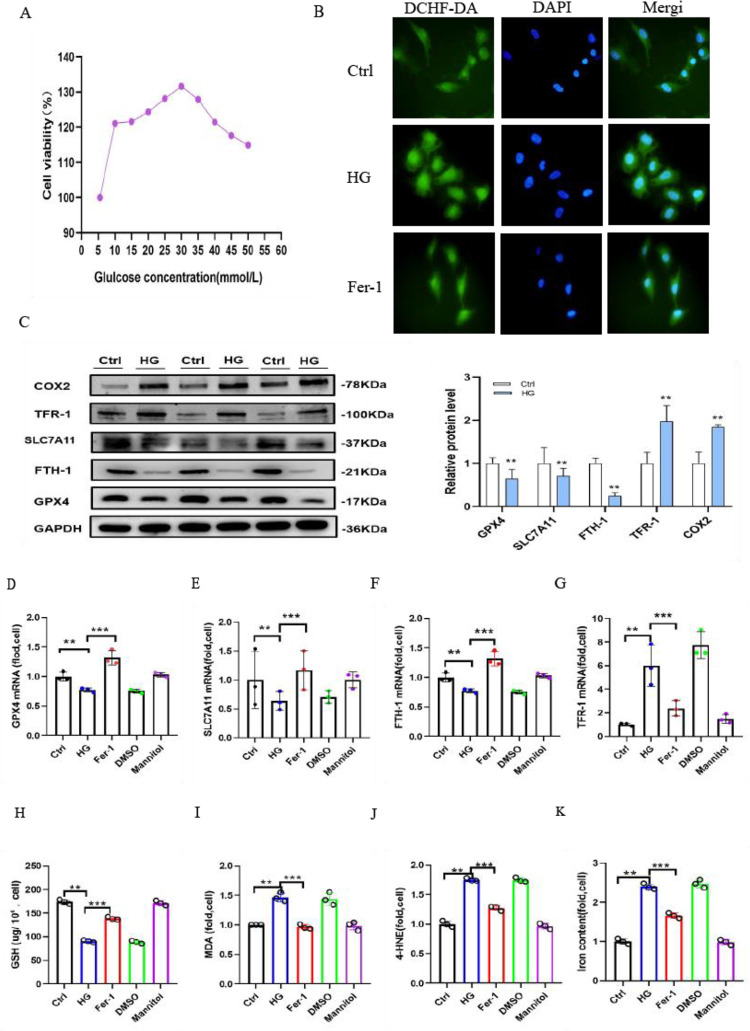
Fig 1. Ferroptosis is a critical component of high glucose-cultured HK-2 cells.
(A) CCK8 was used to detect the viability of HK-2 cells cultured in different concentrations of glucose medium for 48 h. (B) DCHF-DA staining revealed the generation of ROS (green) in high glucose-cultured HK-2 cells compared to the control cells, which was partially reduced by Fer-1 treatment for 48 h. (C) Western blot analysis of GPX4, SLC7A11, FTH-1, COX2 and TFR-1 protein expression in cells in the Ctrl and HG groups. (D-G) GPX4 (D), SLC7A11 (E), FTH-1 (F) and TFR-1 (G) mRNA levels in cells in the Ctrl, HG, Fer-1, DMSO and mannitol groups.(H-K) GSH (H), MDA (I),4-HNE(J) and iron concentrations (K) of cells in the Ctrl, HG, Fer-1, DMSO and mannitol groups. Data are expressed as the mean ± SD. **p < 0.05 vs. Ctrl group; ***p < 0.05 vs. HG group.

