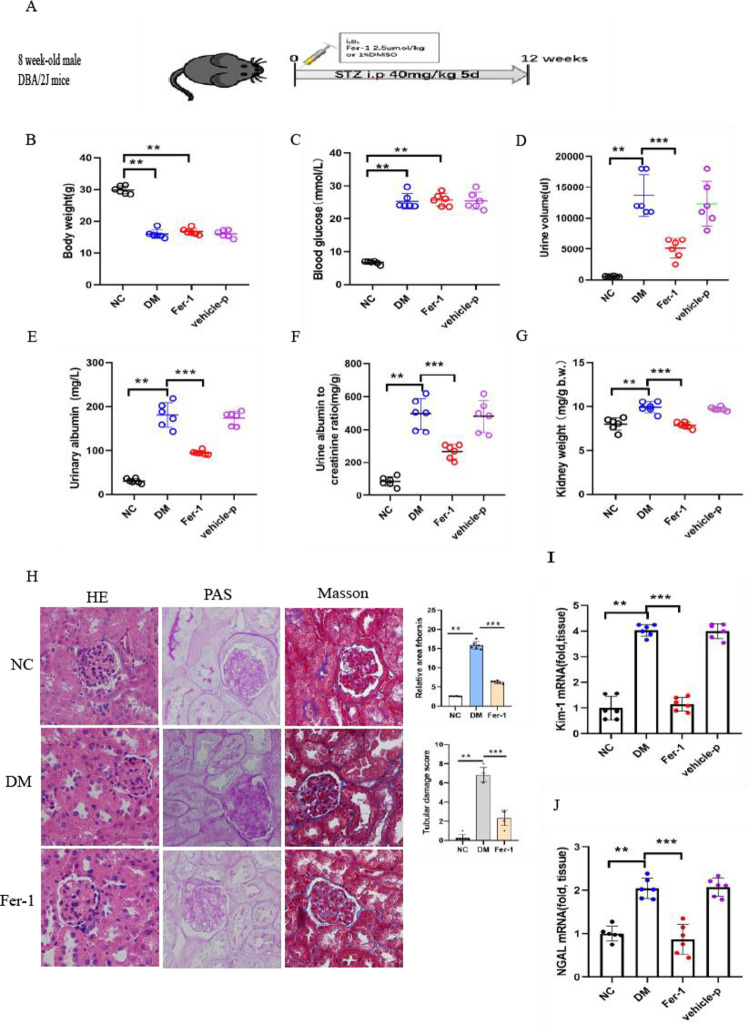
Fig 2. Inhibition of ferroptosis by Fer-1 ameliorated the pathological changes of kidney fibrosis in diabetic kidney disease.
(A) Schematic diagram. Five doses of STZ (40 mg/kg/day IP) were injected to show the induction of diabetes in DM and Fer-1 mice. (B-G) Body weight (B), blood glucose (C), 24-h urine volume (D), urinary albuminuria (E), albumin-to-creatinine ratio ACR (F) and kidney weight/body weight (G) were monitored in the NC, Fer-1, DM and vehicle-P groups. (H) HE staining, PAS staining and Masson staining of kidneys in nondiabetic and diabetic control Fer-1 mice. The relative area of fibrosis (%) and relative collagen (%) were assessed by the ImageJ program. (I-J) The increased KIM-1 and NGAL mRNA expression was relieved by Fer-1 in diabetic mice. Data are the mean ± SEM. **p < 0.05 vs. NC group; ***p < 0.05 vs. DM group.

