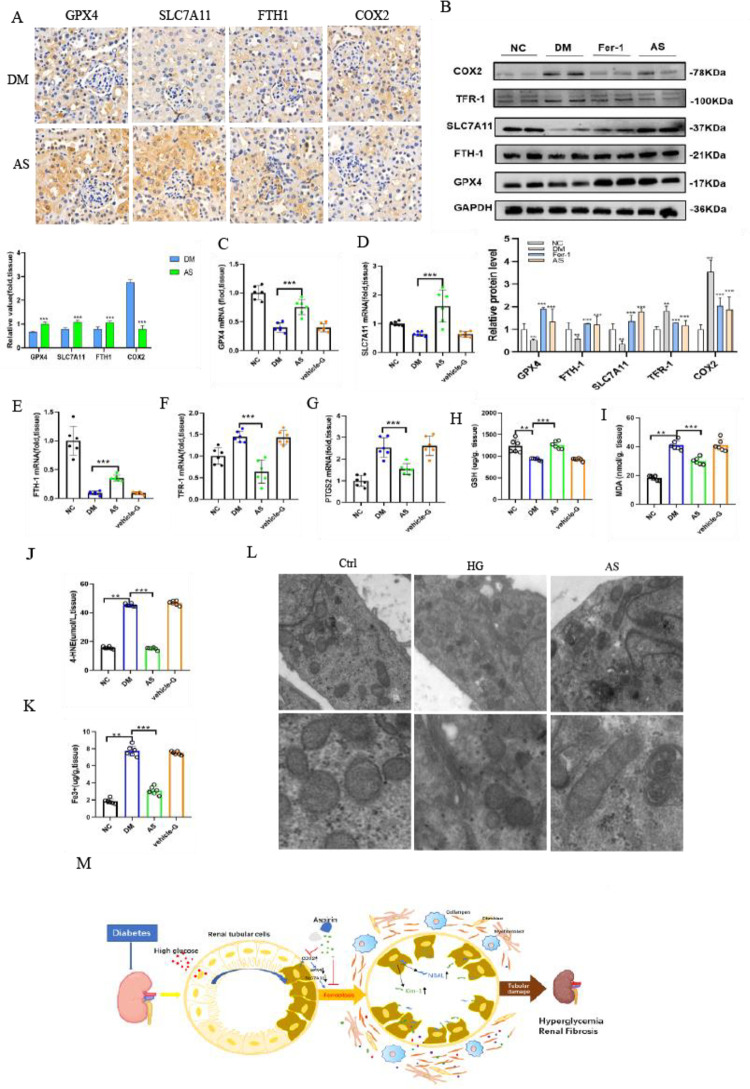
Fig 9. Aspirin ameliorates ferroptosis indices in the diabeitc kidney.
(A) GPX4, SLC7A11, FTH-1 and COX2 of the kidneys in nondiabetic, diabetic control and diabetic treated with AS mice were assessed based on immunohistochemical staining results and semiquantification analyses. (B) Western blot analysis of GPX4, SLC7A11, FTH-1, TFR-1 and COX2 in the kidneys of nondiabetic, diabetic control and diabetic mice treated with AS. (C-G) GPX4 (C), SLC7A11 (D), FTH-1 (E), TFR-1 (F) and PTGS2 (G) mRNA expression in the kidney tissue of mice were measured. (H-K) The GSH (G), MDA (H), 4-HNE (I) and iron concentrations (J) in the kidney tissue were analyzed. (L) The mitochondrial morphology of cells was detected by transmission electron microscopy in the Ctrl, HG and AS groups. (M) Schematic model: COX2/GPX4-mediated ferroptosis in the process of diabetic kidney. Data are the mean ± SEM. **p < 0.05 vs. NC group; ***p < 0.05 vs. DM group.

