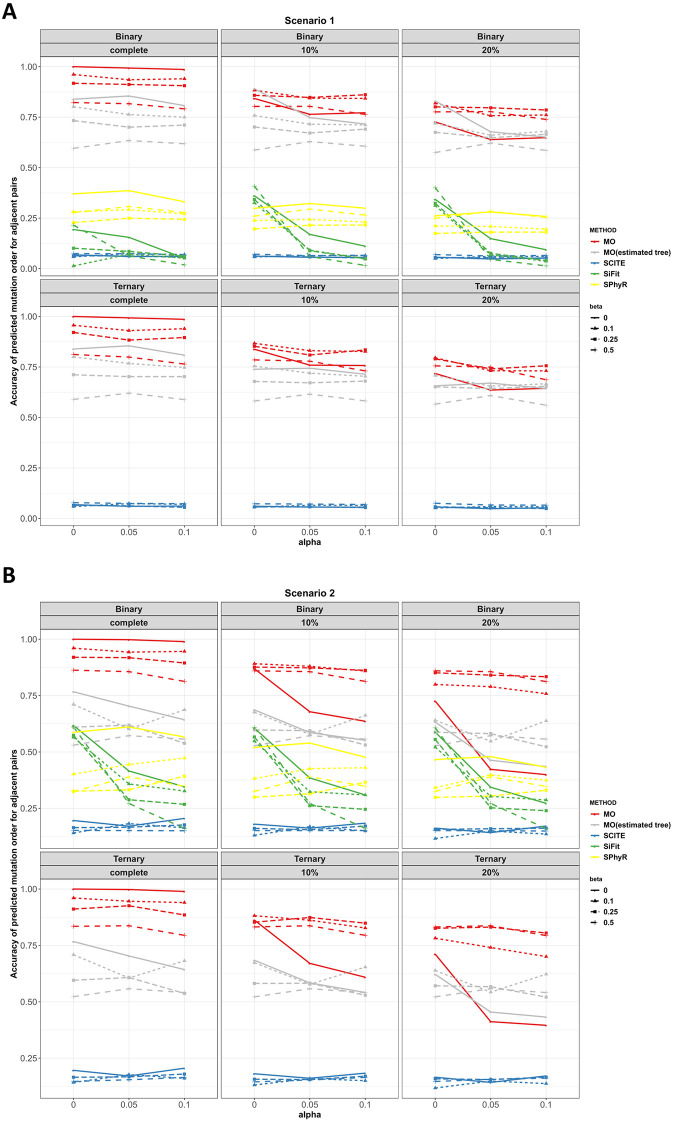
Fig 3. Adjacent order accuracy in scenarios 1 and 2 for MO, SCITE, SiFit and SPhyR when there are 20 mutations.
Each panel includes the results from the specific type of genotype and missing data percentage. In each panel, red, gray, blue, green and yellow colors correspond to MO with the true tree, MO with the estimated tree, SCITE, SiFit and SPhyR, respectively. Each plotting symbol on the line represents a different β. The x-axis is the probability of a false positive error, α, and the y-axis is order accuracy.

