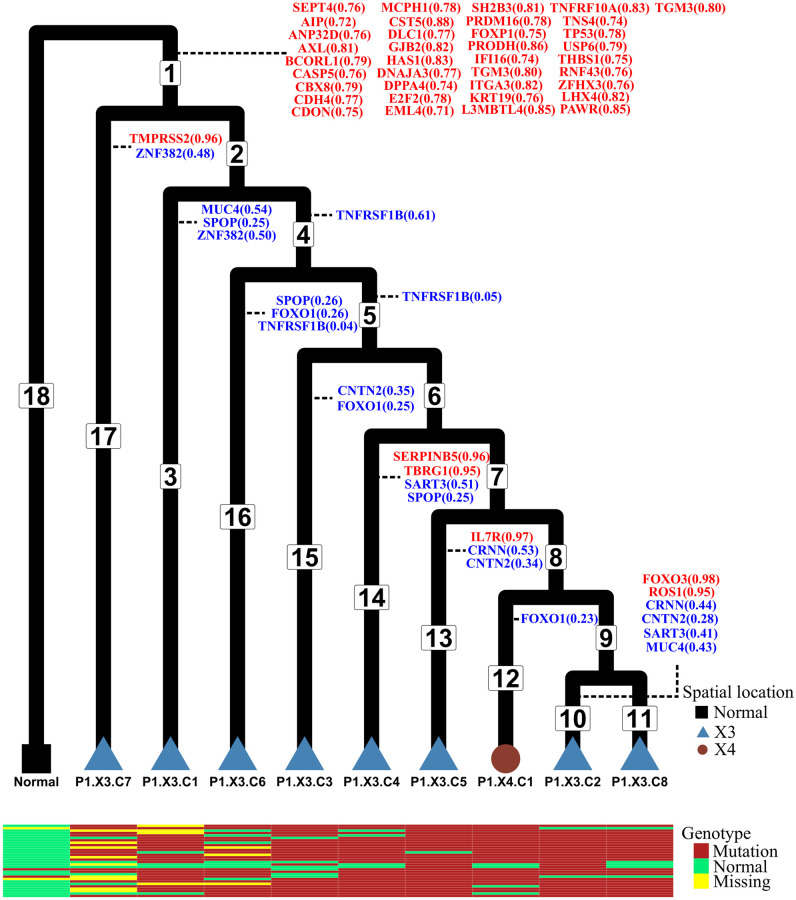
Fig 7. P1 tumor phylogenetic tree and inferred temporal order of the mutations.
The normal cell is set as the outgroup. There are 18 branches in this tree. We do not assume the molecular clock when estimating the branch lengths. Branch lengths in this figure are not drawn to scale. The color and tip shape represent the spatial locations of the samples (normal tissue, location X3 or location X4; see [31]). The temporal order of the mutations is annotated on the branches of the tree. Mutations with very strong signals (probability of occurring on one branch is greater than 0.7) are highlighted in red, while mutations with moderate signals (probabilities that sum to more than 0.7 on two or three branches) are highlighted in blue. Mutation data for 30 genes corresponding to the first 30 rows in Figs R and S in the S1 Text for each tip are shown in the heatmap matrix at the bottom.

