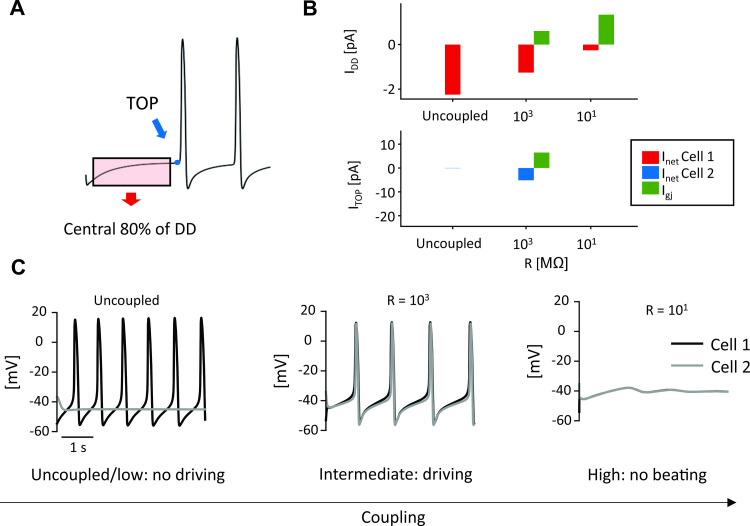
Fig 9. Coupling between a spontaneous cell and a dormant cell.
(A) Average Inet and Igj were extracted from the central 80% portion of the first occurrence of DD (from the beginning of the simulation to the first TOP); TOP Inet and Igj were sampled at the time of the TOP. (B) Inet and Igj trends during diastole (top) for Cell 1 (spontaneous) and at TOP (bottom) for Cell 2 (dormant) with respect to different degrees of cellular coupling. Igj is plotted in green for Cell 1 in both panels (the positive sign indicates an outward current, supplied to Cell 2). (C) Behavior of the two cells depending on coupling: both cells are beating periodically only for intermediate coupling values.

