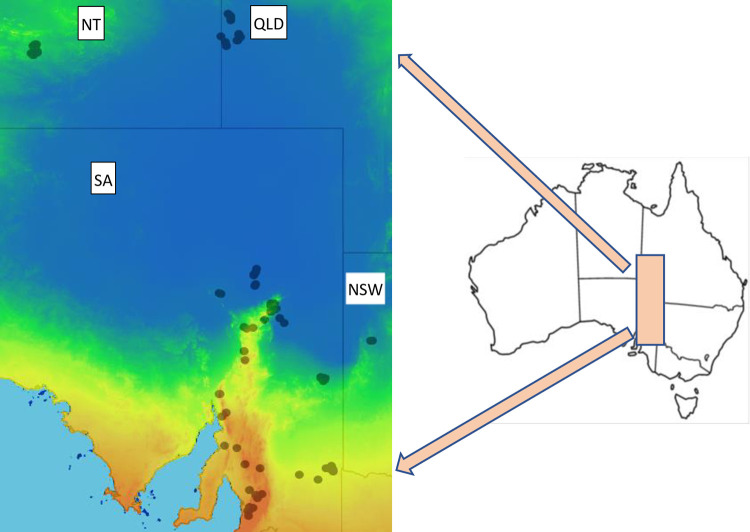
Fig 1. Location of the repeatedly surveyed plots.
Location of the repeatedly surveyed plots within the Northern Territory (NT), Queensland (QLD), South Australia (SA), and New South Wales (NSW). Three plots from Western Australia are not shown. The background layer represents the annual mean aridity index (precipitation/evaporation) from the more arid areas in blue to the more mesic areas in orange. The Australian outline map indicates the location within the continent. Maps downloaded from the Atlas of Living Australia. https://spatial.ala.org.au. Accessed 1 November 2022. Creative Commons license CC BY 3.0 AU.

