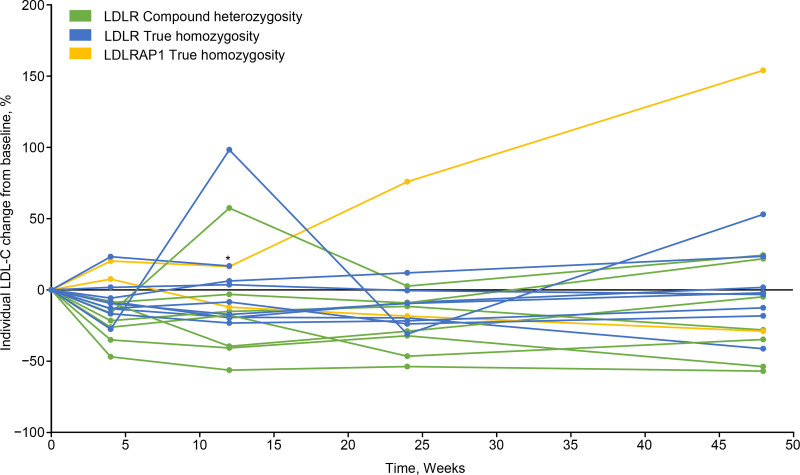
Figure 1.
Individual percent change from baseline in low-density lipoprotein cholesterol (LDL-C) from baseline over the study period, by genotype. Each line represents absolute LDL-C change from baseline for 1 individual patient. *Patient death recorded following treatment discontinuation. LDLR indicates LDL receptor; and LDLRAP1, LDLR adapter protein 1.

