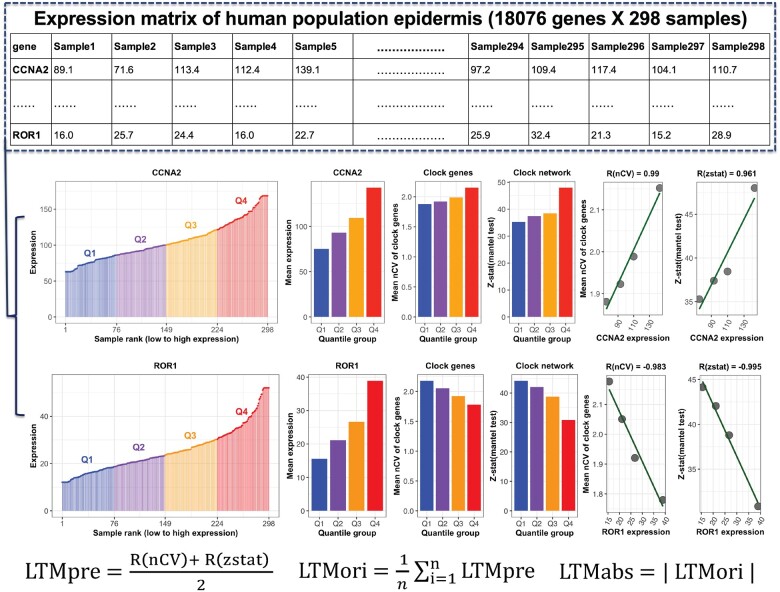
Fig. 1.
The schematic diagram of LTM strategy. The expression matrix contains 18 076 genes (one gene per row) and 298 samples (one sample per column). All 298 samples are ranked by the expression level of each gene (e.g. CCNA2) and separated into four quantile groups. There are 75 (Q1 and Q3) or 74 (Q2 and Q4) samples in each quantile group. The mean expression value of all samples in each quartile group is calculated, as indicated by barplot. Two measures of clock strength were calculated for each quantile group. The first is clock robustness that is indicated by the mean nCV of clock genes in Q1–Q4. The second is phase conservation of clock genes, which is indicated by Mantel’s zstat value. The correlation matrix of clock genes in mouse circadian atlas and in each quantile group serves as the reference and query matrix, respectively. The zstat value of the Mantel test indicates the similarity between a query matrix and the reference matrix. Higher mean nCV value and Mantel’s zstat value means a stronger clock. The correlation value between mean nCV or Mantel’s zstat value and mean expression of CCNA2 (ROR1) from Q1 to Q4 is named as R(nCV) or R(zstat). The LTMpre is defined as the mean value of R(nCV) and R(zstat) of CCNA2 (ROR1). The LTMori is averaged LTMpre values for the same gene. The absolute value of LTMori is defined as the LTMabs

