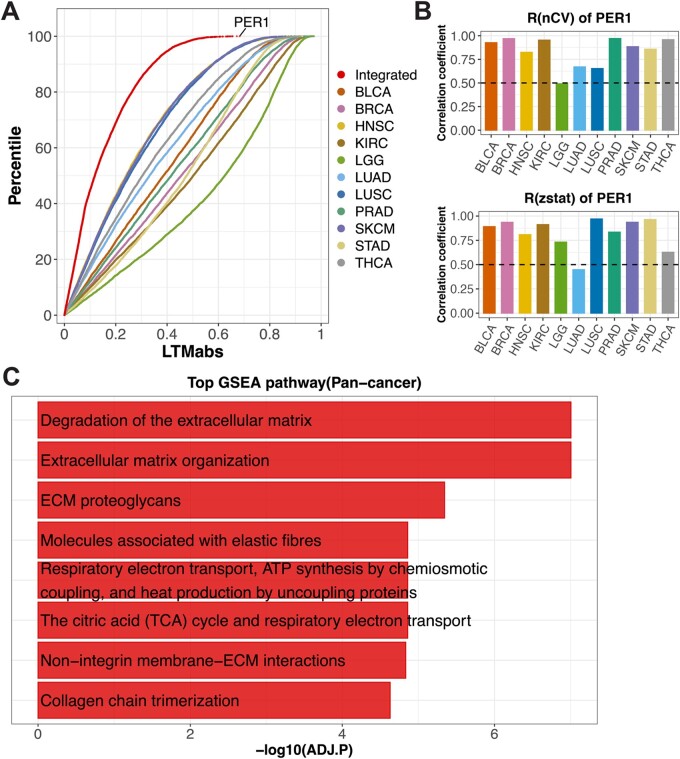
Fig. 3.
LTM screened genes tightly correlated with clock strength in tumors from 11 cancer types. (A) LTM is used to screen tumor samples of 11 cancer types from the TCGA database, including BLCA, BRCA, HNSC, KIRC, LUAD, LGG, LUSC, PRAD, SKCM, STAD and THCA. Different color points indicate the distributions of LTMabs values for different cancer types. ‘Integrated’ represents the LTMabs value of a gene by integrating 11 datasets. (B) The expression level of PER1 is positively correlated with mean nCV of clock genes [R(nCV)] and Mantel’s zstat [R(zstat)] in tumor samples across cancer types. (C) Top eight enriched pathways from GSEA analysis on all genes ranked by integrated-LTMabs values of 11 cancer types

