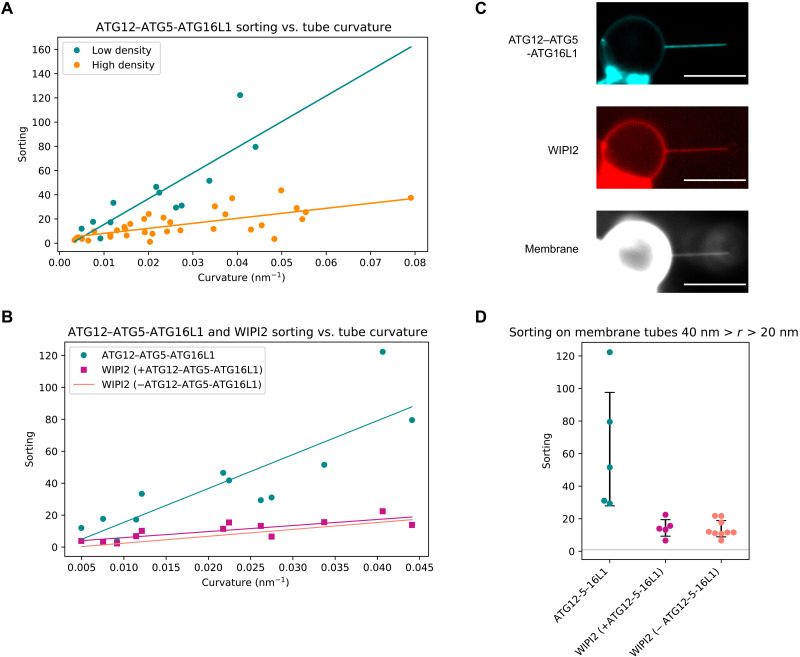
Fig. 2. ATG12–ATG5-ATG16L1 has enhanced curvature sensitivity compared to WIPI2.
(A) Quantification of ATG12–ATG5-ATG16L1 sorting onto membrane tubes at high (cyan, n = 12, r2 = 0.47) and low (orange, n = 33, r2 = 0.72) membrane surface densities of protein. Each data point represents an individual membrane tube. (B) Comparison of sorting dependence on curvature for ATG12–ATG5-ATG16L1 (cyan) and WIPI2 (magenta, r2 = 0.66) with two-color fluorescence imaging compared to sorting of WIPI2 in the absence of ATG12–ATG5-ATG16L1 (salmon). Scale bars, 10 μm. (C) Representative image of membrane tube enrichment of ATG12–ATG5-ATG16L1 and WIPI2 from (A) and (B). (D) Swarmplot depicting the sorting of ATG12–ATG5-ATG16L1 and WIPI2 (n = 5), compared to WIPI2 in the absence of ATG12–ATG5-ATG16L1 (n = 9) on membrane tubes with radii between 20 and 40 nm, black bars indicate SD, and horizontal gray line at S = 1.

