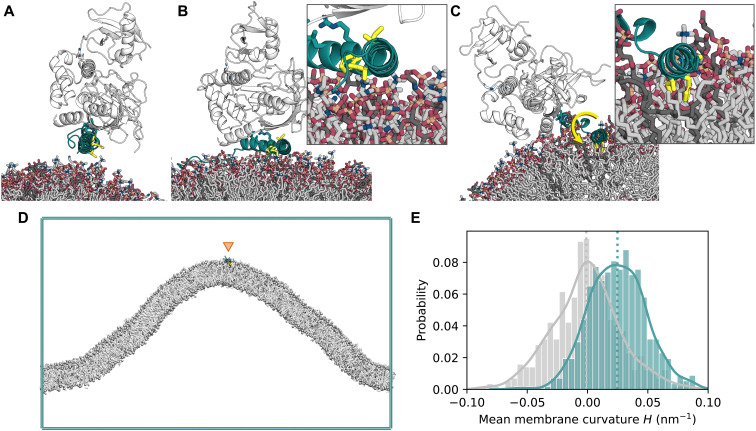
Fig. 6. ATG16L1 helix α2 shows preference for positive curvature in MD simulations.
(A) Initial structure (PDB ID: 4NAW) of ATG16L1 helix α2 (cyan) in complex with ATG12-5 (white) near the membrane. The hydrophobic-face residues Phe32, Ile35, and Ile36 are highlighted as yellow sticks. Negatively charged lipids [PI(3)P, POPI, and DOPS] are shown as dark gray sticks, with neutral lipids (DOPC and DOPE) in lighter gray. (B) Snapshot of ATG1612–5-L1 interacting with the membrane surface during one (1 μs) simulation replicate, with rotation of the hydrophobic face by ~180°. (C) End frame of a 300-ns replicate with helix α2 embedded into the membrane. (D) End frame of a 50-μs coarse-grained curvature sampling simulation replicate with ATG16L1 helix α2 (residues 26 to 45; located at the positively curved cusp of the membrane fold). (E) Probability histogram of local mean curvature values sampled at the center of mass of helix α2 (cyan) and at random lipid phosphate positions (gray) during the same simulations, with data collected over six independent 50-μs replicates, after an equilibration period of 5 μs upon each membrane binding event.

