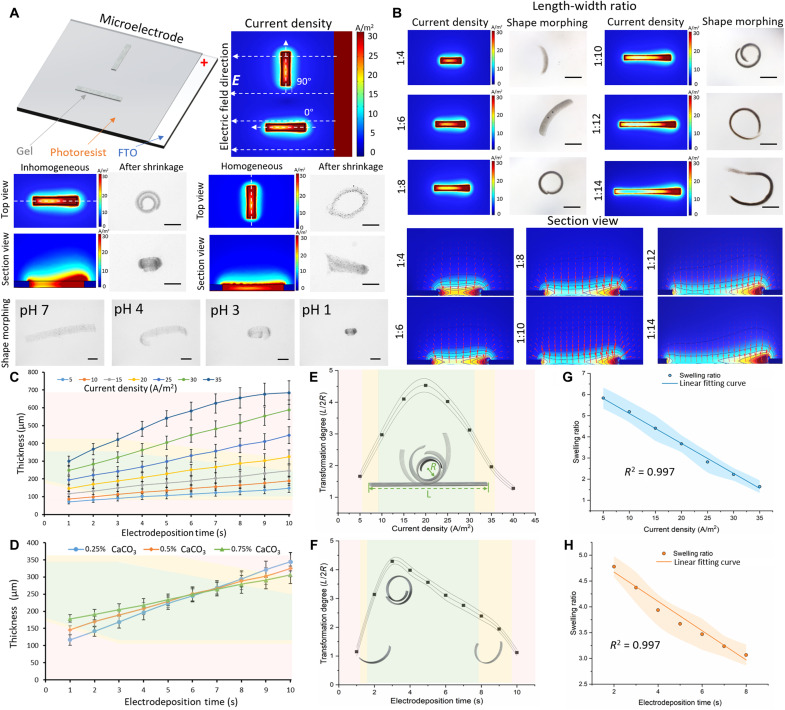
Fig. 2. Bending deformation of a stripe-shaped hydrogel microstructure.
(A) Current density simulation and shape morphing of horizontally and vertically stripe-shaped hydrogel microstructures under pH response. Scale bars, 300 μm. (B) Current density simulation and shape morphing of the stripe-shaped hydrogel microstructures with various length-to-width ratio. Scale bars, 300 μm. (C) Time-dependent electrodeposition thickness as a function of current density. Each dot represents the average thickness of five different MMRs under a pH shift with stripe shapes ± SEM. (D) Time-dependent electrodeposition thickness as function of CaCO3 concentration. The green area indicates that the microstructures can perform shape morphing. The yellow area indicates that the microstructures can perform partial shape morphing. The red area indicates that the microstructures perform almost no shape morphing. Each dot represents the average thickness for five different MMRs under a pH shift with stripe shapes ± SEM. (E) Transformation degree of the hydrogel microstructures with various current densities represented by the ratio between the half length of the stripe-shaped microstructure (L/2) and the minimum radius of curvature of the spiral microstructure (R). Each dot represents the average transformation degree of structures with stripe shapes ± SEM with n = 5. (F) The transformation degree of the hydrogel microstructures with various electrodeposition durations. Each dot represents the average transformation degree of structures with stripe shapes ± SEM with N = 5. (G) Swelling ratio between the volume of the stripe-shaped microstructures formed with different current densities before and after shrinkage (Vbefore/Vafter). Each dot represents the average swelling ratio of structures with stripe shapes ± SEM with N = 5. (H) Swelling ratio of the stripe-shaped microstructure volumes formed with different electrodeposition times before and after shrinkage (Vbefore/Vafter). Each dot represents the average swelling ratio of structures with stripe shapes ± SEM with N = 5.

