. 2022 Dec 14;11:e82621. doi: 10.7554/eLife.82621

Figure 1. Detection of Piezo1 in RBCs.

(A) Reconstructed 3D-structured illumination microscopy (3D-SIM) images of red blood cells (RBCs), shown as maximum projections of z-stacks, from control (Ctrl, top row) or Piezo1HA (bottom row) mice labeled using rhodamine phalloidin (magenta) and an antibody directed against the HA tag of Piezo1 (green). Scale bar, 3 μm. (B) 3D volume rendering of a representative labeled Piezo1-HA-KI mouse RBC displayed as XY (left) and XZ (right) axis views, showing the distribution of Piezo1. Scale bar, 2 μm. (C) Quantification of the number of Piezo1 spots per cell from 3D-SIM maximum projections. Mean ± standard deviation (SD) = 80.2 ± 26 spots per cell. Numbers were calculated on individual cells (n = 57) using Imaris spot detection. (D) Representative single channel traces from excised inside-out patch recordings of RBCs in symmetric 150 mM NaMethanesulfonate. The patch was clamped at −80 mV and negative pressure (0 to −30 mm Hg) was applied to the patch pipette. Amplitude histogram (right) enables estimation of single channel conductance. Showing one trace from n = 4 recordings.

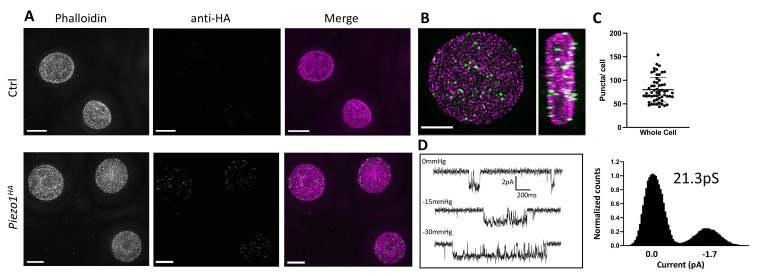
Figure 1.

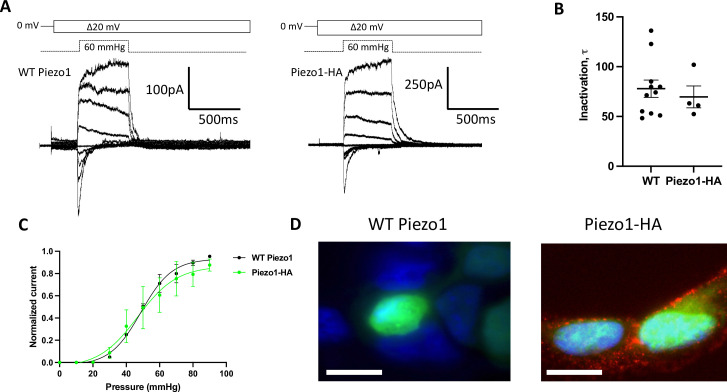
Figure 1—figure supplement 1. In HEK293 cells HA-tagged Piezo1 behaves like wildtype Piezo1 in electrophysiology recordings and can be specifically detected by immunostaining.

Figure 1—figure supplement 1.

(A) Representative traces of currents elicited at 60 mm Hg pressure and increasing voltages (in 20 mV steps from −80 to +80 mV) in symmetrical NaCl from excised outside-out patches of HEK293 Piezo1 KO cells overexpressing wildtype (left) or HA-tagged mPiezo1 (right). (B) Inactivation time-constants for wildtype and HA-tagged mouse Piezo1 with a holding voltage −80 mV and pressure pulses of +60 mm Hg. (C) Outside-out patches were held at +60 mV and subjected to 500-ms pulses of increasing pressure. Normalized mean current–pressure relations are shown. For each individual patch, currents were normalized to the peak current for that patch. (D) Immunofluorescence in HEK293 Piezo KO cells expressing wildtype or HA-tagged mPiezo1 in a Piezo1-IRES-GFP (green) vector stained with anti-HA primary antibody and Alexa 568-conjugated secondary antibody (red). Membranes were not permeabilized and nuclear stain 4’,6’-diamidino-2-phenylindole (DAPI) (blue) was used for nuclear staining. Scale bars, 10 µm.
Figure 1—figure supplement 2. Representative images of XY and XZ two dimensional slice views from SIM images of immunostained red blood cells (RBCs) from Piezo1-HA mice.

Figure 1—figure supplement 2.

Piezo1 is in green and actin stained by phalloidin is in magenta. Piezo1 spots are observed adjacent to the actin signal, which is a proxy for the membrane in RBCs. Scale bars, 1 μm.