. 2022 Dec 14;11:e82621. doi: 10.7554/eLife.82621

Figure 3. Piezo1 localization is enriched in the curved dimple regions of the red blood cell .

(A) Two dimensional slices in XY and YZ views from SIM images illustrating volume segmentation of RBCs and Piezo1 puncta distribution after labeling with an antibody against Piezo1-HA (green) and rhodamine–phalloidin for F-actin (magenta). Cells were segmented and masked in Imaris as shown. Scale bar, 1 μm. (B) Distribution of Piezo1 puncta in RBCs. The RBC dimple has a higher density of Piezo1 puncta than whole RBCs (Total) (p = <0.0001) and the rim region (p = <0.0001) by the one-way analysis of variance (ANOVA) test with Tukeys post hoc analysis, as indicated on the graph by asterisks where *** indicates p<0.001 and **** indicates p<0.0001. N = 39 cells (C) The ratio of Piezo1 spot density (1.87 ± 0.76, N = 39 cells) in the dimple and rim region of RBCs compared to that of KCNN4 (0.99 ± 0.36, N = 12 cells), Band3 (0.95 ± 0.33, N = 20 cells), and Actin (0.93 ± 0.36, N = 31 cells). The dimple over rim ratio is higher for Piezo1 than KCNN4 (p = 0.0003) and Band3 (p = 0.0003) and Actin (p < 0.0001). (D) Scatterplot of ratio of Piezo1 puncta density in dimple over rim plotted against RBC biconcavity, measured as height ratio a/b (see inset). N = 37 cells. Data are fit by linear regression with equation y = 1.08x + 0.55, R2 = 0.34 and p = 0.0001. (E) Probability per unit area for finding a Piezo1 channel at a given RBC membrane location, calculated from a physical model of Piezo1 curvature coupling (see methods) and plotted over the RBC membrane surface. The RBC shape corresponds to Beck’s model of for RBC discocytes (Beck, 1978).

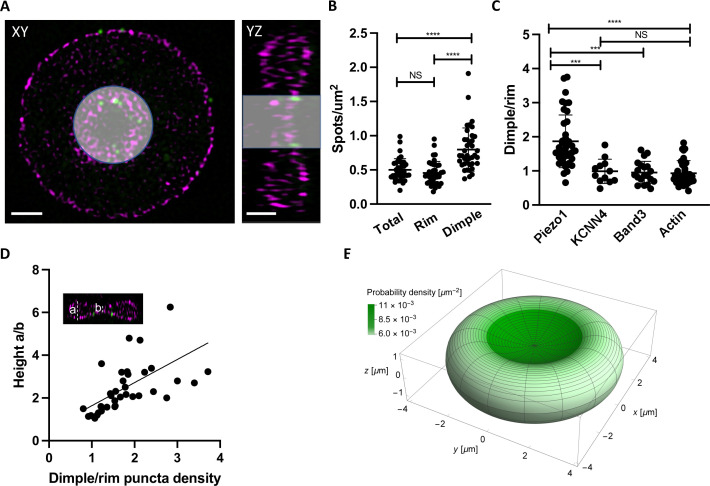
Figure 3.

Figure 3—figure supplement 1. Examples of two cells with different biconcavities and analysis of PNGase F treatment on Piezo1 distribution.

Figure 3—figure supplement 1.

(A) 2D slices of a red blood cell (RBC) with a biconcavity (measured as the ratio of maximum to minimum heights of the RBC along a central XZ slice) of 6.25 and a relative dimple to rim Piezo1 spot density of 2.83. (B) As in (A) but of a RBC with a biconcavity of 1.1 and a relative dimple to rim density of 1.05. Scale bar, 1 μm. (C) Comparison of the number of Piezo1 spots per cell from 3D-structured illumination microscopy (3D-SIM) maximum projections of RBCs prepared with or without PNGase F treatment. For cells treated with PNGase F mean ± standard deviation (SD) = 80.2 ± 26.0 spots per cell (N = 57 cells) and for cells not treated with PNGase F mean ± SD = 17.3 ± 6.3.0 spots per cell (n = 19 cells). (D) Comparison of the Piezo1 spot density in the dimple over rim region of RBCs prepared with or without PNGase F treatment. For cells treated with PNGase F mean ± SD = 1.87 ± 0.76 (N = 39 cells) and for cells not treated with PNGase F mean ± SD = 1.81 ± 0.77 (N = 18 cells).
Figure 3—figure supplement 2. Piezo1 is depleted from membrane regions of high positive curvature in echinocytes.

Figure 3—figure supplement 2.

(A) Brightfield imaging of red blood cells (RBCs) treated with 10 mM NaSalicylate to generate echinocytes. Two examples of echinocytes are indicated with red arrows. Scale bar, 2 μm. (B) Example of an echinocyte labeled with an anti-HA antibody against Piezo1 (green) and rhodamine–phalloidin to label F-actin (magenta). White arrows indicate membrane protrusions of positive curvature where Piezo1 is clearly excluded. Scale bar, 500 nm. (C) as in (B) but with the F-actin signal shown as a translucent surface representation (magenta) and the fluorescent Piezo1 spots in green for easier visualization of exclusion of Piezo1 from membrane protrusions. Scale bar, 500 nm. (D) Left and right are two different Z-slice images from the echinocyte in (B) to illustrate in 2D the exclusion of Piezo1 from membrane protrusions. Scale bar, 500 nm.