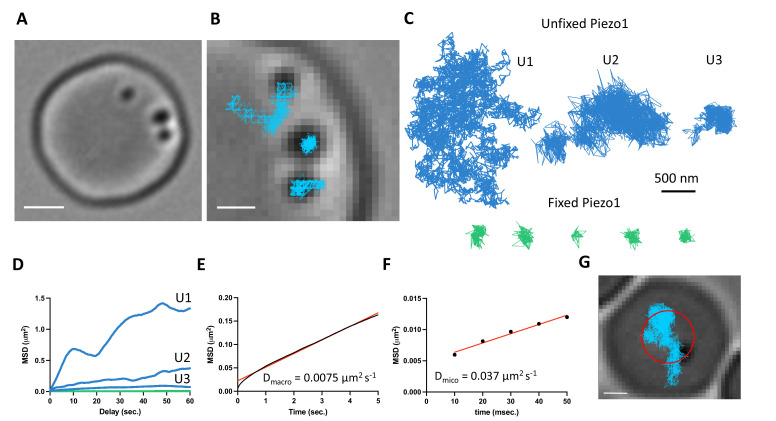
Figure 4. Gold-particle tracking of Piezo1 reveals its lateral mobility in the red blood cell membrane.
(A) Example of a RBC imaged under DIC microscopy showing three 40-nm gold particle-labeled Piezo1 channels. Scale bar, 2 μm. (B) Close-up image of the gold particles with trajectories from a 2-min recording at 100 Hz frequency. Scale bar, 1 μm. (C) Representative trajectories corresponding to distinct Piezo1 diffusive behaviors in unfixed conditions, shown in blue (trajectories U1, U2, and U3). The green trajectories correspond to labeled Piezo1 in cells fixed with paraformaldehyde (PFA). (D) MSD against time for the first 60 s of the trajectories U1, U2, and U3 in C corresponding to unfixed conditions (blue) and an average of n = 5 fixed trajectories (green). (E) MSD against time for the first 5 s of an average of 14 trajectories. The data are fit to a straight line with a slope corresponding to a 2D diffusion coefficient of 0.0075 μm2 s−1. R2 for linear fit to data is 0.99. (F) MSD against time for the first 50 ms of an average of 14 trajectories. The data are fit to a straight line with a slope corresponding to a 2D diffusion coefficient of 0.037 μm2 s−1. R2 for linear fit to data is 0.98. (G) Image of a RBC with a single gold-labeled Piezo1 channel that was recorded for 1 hr at 1 Hz frequency. Superimposed are the final tracking result (blue) and a circle (red) indicating the approximate segmentation of the RBC dimple. Scale bar, 1 μm.


