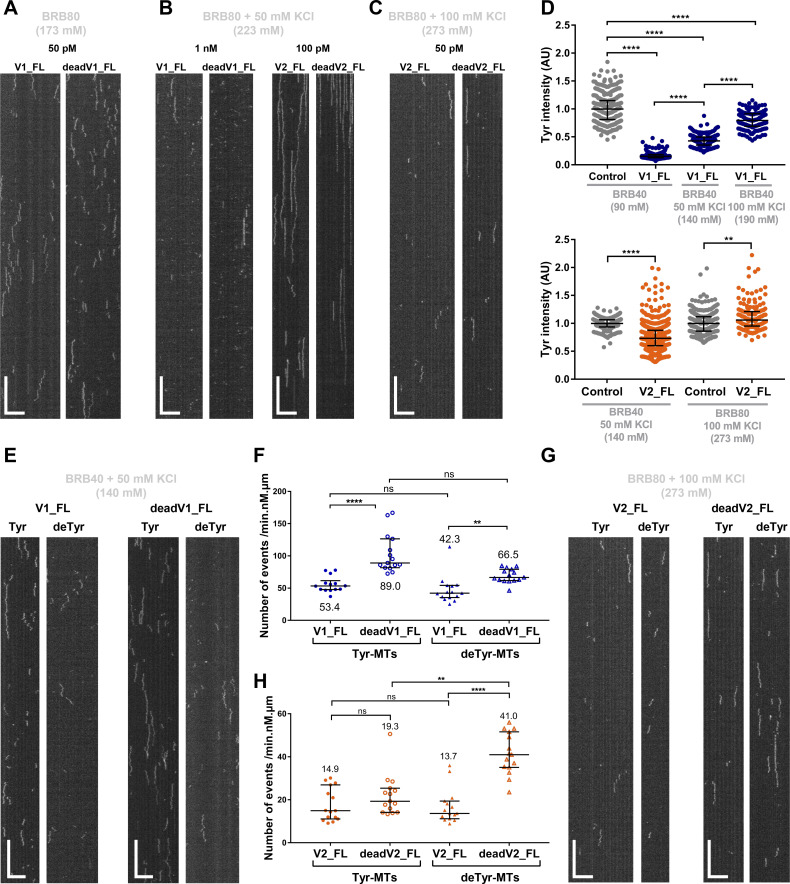
Figure 2.
Ionic strength has a strong impact on the interaction of VASH–SVBP complexes with microtubules, whereas tyrosinated-tubulin depletion disrupts less the interaction. (A−D) Effect of ionic strength. Experiments were performed in the indicated buffers. Ionic strengths are indicated in brackets in mM. (A−C) TIRF microscopy study. Representative kymographs of single molecules of sfGFP-tagged VASH1–SVBP and VASH2–SVBP (V1_FL, deadV1_FL, V2_FL, and deadV2_FL) at the indicated concentrations bound to Taxol-stabilized Tyr-MTs. Scale bars: horizontal, 5 µm; vertical, 5 s. Binding characteristics are summarized in Table 1, B–D. (D) Activity measurement by immunofluorescence. Analysis of tyrosinated signals intensities after 30 min incubation in the absence (control) or presence of 50 pM enzymes. Each point represents a microtubule (at least 150 microtubules were analyzed). Data are represented as the median with the interquartile range. (E−H) Effect of decreasing tyrosinated tubulin. TIRF microscopy study of single molecules of sfGFP-tagged VASH1–SVBP (V1_FL and deadV1_FL, 50 pM) and VASH2–SVBP (V2_FL and deadV2_FL, 50 pM) bound to Taxol-stabilized Tyr-MTs or deTyr-MTs. Binding characteristics are summarized in Table 1. (E and G) Representative kymographs. Scale bars: horizontal, 5 µm; vertical, 5 s. (F and H) Analysis of binding frequency. Each point represents a microtubule. At least 15 microtubules were analyzed. Data are represented as the median with the interquartile range. Statistical significance was determined using Kruskal-Wallis test. **P < 0.009, ****P < 0.0001.

