Figure 3.
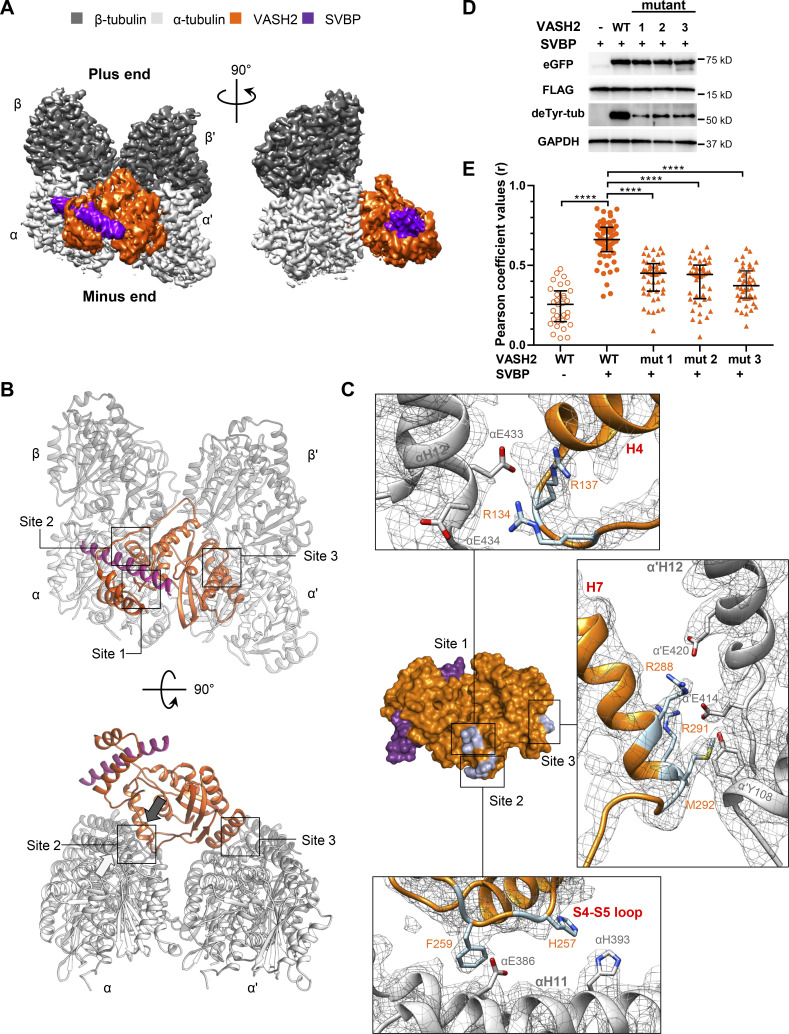
Cryo-EM reconstruction of the microtubule–VASH2–SVBP complex reveals their interaction sites. (A) Electron density map of VASH2–SVBP (catalytically dead version of VASH2 carrying the Cys158Ala mutation) bound to a GMPCPP-stabilized microtubule. A map region of two laterally associated αβ-tubulin dimers from two adjacent protofilaments bound to one VASH2–SVBP complex is shown in two different orientations 90° apart. (B) Overview of the three microtubule–VASH2–SVBP interacting sites from two different orientations 90° apart. Sites 1 and 2 involve the substrate α-tubulin while site 3 involves the α’-tubulin subunit of an adjacent protofilament in the microtubule. All molecules are displayed in cartoon representation. The white arrow close to site 2 in the lower panel indicates the C-terminus of helix αH12 and the black arrow denotes the facing direction of the positively charged groove on VASH2. (C) Surface representation of the VASH2–SVBP structure with the microtubule-binding residues highlighted in orange stick. Insets correspond to VASH2 and tubulin residues implicated in the three interaction sites, displayed in stick representation and labeled in orange and gray, respectively. The α-tubulin, β-tubulin, VASH2, and SVBP molecules are shown in light gray, dark gray, orange, and violet, respectively. (D) Immunoblots of in cellulo tubulin detyrosination assays with WT VASH2 or VASH2 mutants 1 (R134A-R137A), 2 (H257A-F259A), or 3 (R288A-R291A-M292A), and SVBP. Uncropped images are shown in source data. (E) Quantification of the colocalization between VASH2 proteins and microtubules. NIH3T3 cells were cotransfected with plasmids encoding WT or mutant VASH2-eGFP, and SVBP-myc-FLAG. Representative immunofluorescence images are shown on Fig. S4. Each point represents a different cell; at least 8 cells from three independent experiments were analyzed. Bars represent the median and interquartile range. Statistical significance was determined using the Kruskal-Wallis test, ****P < 0.0001. Source data are available for this figure: SourceData F3.

