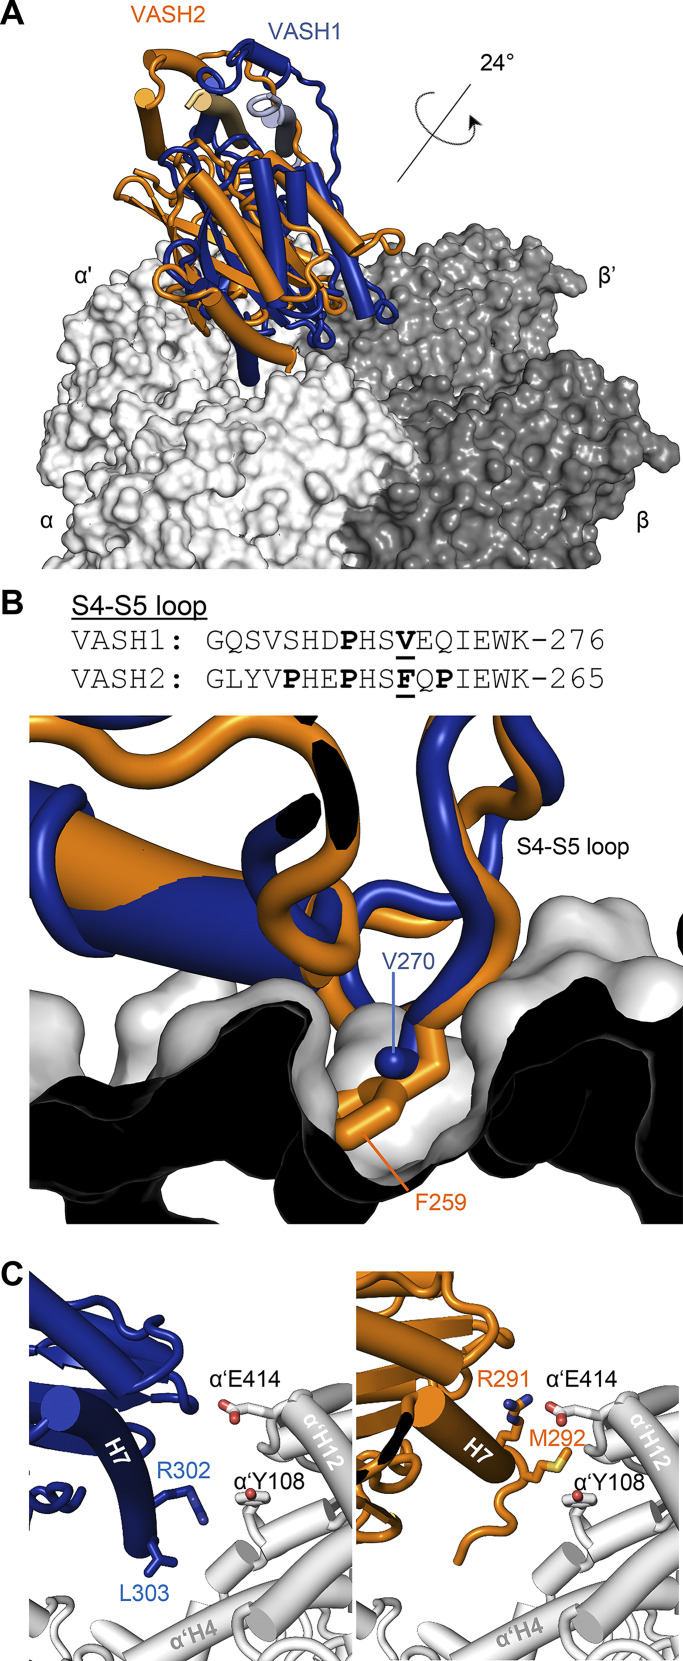
Figure 4.
Comparison between the microtubule-binding modes of VASH1–SVBP and VASH2–SVBP. (A) Superimposition of the microtubule-VASH1–SVBP (PDB ID 6WSL, blue) and microtubule–VASH2–SVBP (PDB ID 7ZCW, orange) structures reveals a 24° tilt between the two enzyme complexes. (B) Superimposing the VASH2–SVBP structure (orange) onto the microtubule-bound VASH1–SVBP (blue) structure shows a steric clash of Phe259 of the β4-β5 loop of VASH2–SVBP with α-tubulin. On the top, a sequence alignment of the β4-β5 loops of VASH1 and VASH2 is shown with proline residues highlighted in bold. Phe259 of VASH2 and the corresponding Val270 of VASH1 are also highlighted in bold and are underlined. (C) At site 3, the tilt between the VASH1–SVBP (blue) and VASH2–SVBP (orange) enzyme complexes leads to a shift in the position of helix H7 with respect to α’-tubulin.

