Figure 5.
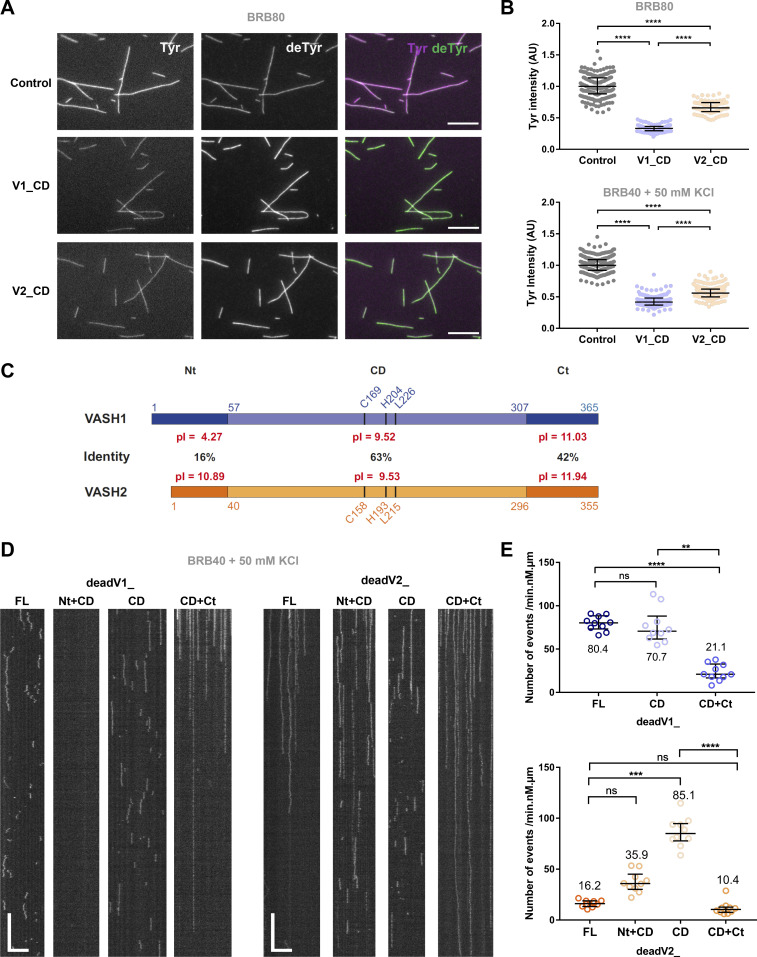
The N- and C-terminal regions of VASH1 and VASH2 are crucial for their microtubule binding and detyrosination activity. (A and B) Activity of enzyme complexes containing the sfGFP-tagged central core domains of VASH1 and VASH2 with SVBP (V1_CD and V2_CD) bound to Taxol-stabilized Tyr-MTs measured by immunofluorescence in TIRF experimental conditions (50 pM enzyme, BRB80 or BRB40 supplemented with 50 mM KCl, TIRF chamber). (A) Representative images of tyrosinated (Tyr, magenta) and detyrosinated (deTyr, green) α-tubulin pools of microtubules after 30 min in the absence (control) or presence of the enzyme’s core domains. Scale bar, 10 µm. (B) Analysis of tyrosinated and detyrosinated tubulin signals intensity. Each point represents a microtubule (at least 80 microtubules were analyzed). Data are represented as the median with interquartile range. Statistical significance was determined using Kruskal-Wallis test, ****P < 0,001. (C) Schematic representations of human VASH1 (blue) and VASH2 (orange) which are transglutaminase-like cysteine peptidases containing a triad of catalytic residues (Cys, His, and Leu). These proteins share 58% overall sequence identity (74% homology). Identities between core domains (CD, light colored boxes), and between N- and C-terminal regions (Nt and Ct respectively, dark colored boxes) are specified on the diagram. Isoelectric points (pI) of each domain are also provided. The residue numbers are indicated. (D and E) TIRF microscopy study of single molecules of sfGFP-tagged catalytically dead versions of VASH1 and VASH2 full-length versions (dead V1_FL and deadV2_FL), core domains (deadV1_CD and deadV2_CD), and truncated versions missing the flanking regions (deadV1_Nt + CD, deadV1_CD + Ct, deadV2_Nt + CD, deadV2_CD + Ct) bound to Taxol-stabilized Tyr-MTs. Experiments were performed in the presence of 50 pM enzyme in BRB40 supplemented with 50 mM KCl. (D) Representative kymographs. Scale bars: horizontal, 5 µm; vertical, 5 s. (E) Analysis of binding frequency. Each point represents a microtubule. Data are represented as the median with the interquartile range. Statistical significance was determined using Kruskal-Wallis test. **P < 0.002 ***P < 0.0002, ****P < 0.0001. Results for VASH1–SVBP are in blue and for VASH2–SVBP in orange.

