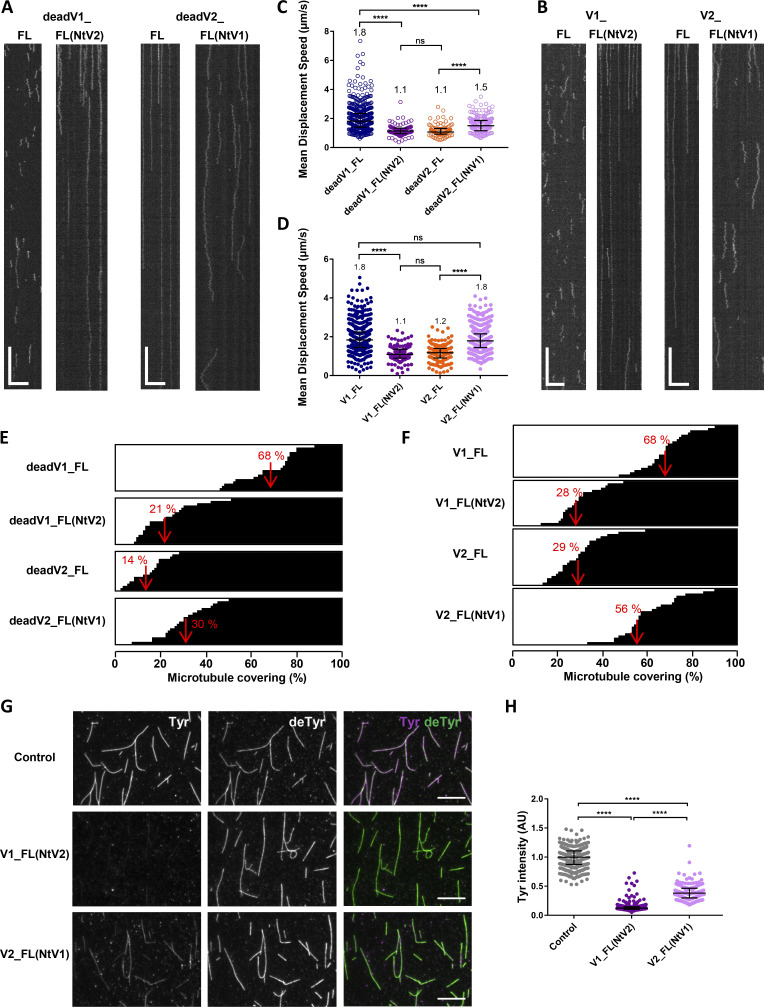
Figure 6.
The exchange of the N-terminal regions strongly alters binding behavior and activity of VASH–SVBP enzyme complexes. (A−F) Comparison of the interaction with Taxol-stabilized Tyr-MTs of the sfGFP-tagged full length VASH1 and VASH2 enzymes (V1_FL, V2_FL) and chimeras in which the N-termini were exchanged [V1_FL(NtV2), V2_FL(NtV1)]. Both catalytically dead (A, C, and E) and active (B, D, and F) versions were studied. Experiments were performed in the presence of 50 pM enzyme in BRB40 supplemented with 50 mM KCl. (A and B) Representative kymographs. Scale bars: horizontal, 5 µm; vertical, 5 s. Examples of TIRF movies from which kymographs were extracted are presented in supplemental data for the chimeras (Videos 3 and 4). Binding characteristics are summarized in Table 3. (C and D) Analysis of diffusion. Each point represents a single molecule, the molecules moving on at least 17 microtubules were analyzed. (E and F) Representation of the microtubule surface covered with VASH–SVBP molecules (white) or not covered (black) during the 45 s of TIRF movies. Each horizontal line represents a microtubule (at least 17 microtubules were analyzed). The red value corresponds to the mean covering (in %). (G and H) Activity of VASH–SVBP enzyme complexes and chimeras on Tyr-MTs measured by immunofluorescence in the same experimental conditions (50 pM enzyme, BRB40 supplemented with 50 mM KCl, TIRF chamber). (G) Representative images of tyrosinated (Tyr, magenta) and detyrosinated (deTyr, green) α-tubulin pools of microtubules after 30 min incubation in the absence (control) or presence of the indicated enzyme. Scale bar, 10 µM. (H) Analysis of tyrosinated- and detyrosinated-tubulin signals intensities. Each point represents a microtubule (at least 200 microtubules were analyzed). Data are represented as the median. Statistical significance was determined using Kruskal-Wallis test, ****P < 0.0001.

